MILLER: The Statistical Fundamentals of (Non-)Replicability
“Replicability of findings is at the heart of any empirical science” (Asendorpf, Conner, De Fruyt, et al., 2013, p. 108)
The idea that scientific results should be reliably demonstrable under controlled circumstances has a special status in science. In contrast to our high expectations for replicability, unfortunately, recent reports suggest that only about 36% (Open Science Collaboration, 2015) to 62% (Camerer, Dreber, Holzmeister, et al., 2018) of the results reported in various areas of science are actually reproducible. This is disturbing because researchers and lay persons alike tend to accept published findings as rock solid truth. As Mark Twain reportedly put it,
“It ain’t what you don’t know that gets you into trouble. It’s what you know for sure that just ain’t so.”
Dismay over poor replicability is widespread, with 90% of surveyed researchers reporting that there is at least some replicability crisis in their fields (Baker, 2016).
The theme of this article is that it is important to understand the fundamental statistical issues underlying replicability. When pressed, most researchers will concede that replicability cannot be completely guaranteed when random variability affects study outcomes, as it does in all areas where replicability is a concern. Due to random variability, there is always some probability of getting unrepresentative results in either the original study or its replication, either of which could produce a replication failure.
If a successful replication is only probabilistic, what is its probability? I will show how easily-understood statistical models can be used to answer this question (for a more mathematically in-depth treatment, see Miller & Schwarz, 2011). The results are illuminating for at least two reasons:
1) Knowing what replication probability should be expected on purely statistical grounds helps us calibrate the severity of the replicability problem. If we should expect 99% replication success, then the reported values of 36% to 62% indicate that something has gone seriously wrong. If we should only expect 50% replication success, though, then perhaps low replicability is just another part of the challenge of science.
2) If something has gone wrong, then seeing what kinds of things cause poor replicability would almost certainly help us find ways of addressing the problems.
What is replicability?
To construct a statistical model of replicability, it is first essential to define that term precisely, and many reasonable definitions are possible. I will illustrate the essential issues concerning replicability within the context of the standard hypothesis testing framework shown in Table 1. Parallel issues always arise—though sometimes under different names—in alternative frameworks (see “Concluding comments”).
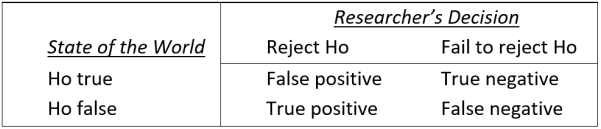 TABLE 1: Standard classification of researchers’ decisions within the hypothesis testing framework. Researchers test a null hypothesis (Ho) which is either true (to an adequate approximation) or false. At the conclusion of the study, either they decide that Ho is false and reject it—a “positive” result, or else they decide that Ho may be true and fail to reject it—a “negative” result. Researchers will sometimes make incorrect decisions (e.g., false positives and false negatives), partly because their results are influenced by random variability.
The great majority of published studies report positive results within the framework of Table 1 (Fanelli, 2012), so it is common to define a successful replication simply as a positive result in study 1 (the initial published finding) followed by a positive result in study 2 (the replication study).
A model for replication probability
To understand the probability of a successful replication as just defined, it is useful to consider what happens across a large number of studies, as is illustrated in Figure 1.
 FIGURE 1. A model for computing the probability of replication. The values in red represent parameters describing the research area for which replication probability is to be computed, and the model illustrates how the replication probability and other values can be computed from these parameters.
Proceeding from left to right across the figure, the model starts with a large set of studies conducted by the researchers in the area for which replication probability is to be determined. In medical research, for example, these might be studies testing different drugs as possible treatments for various diseases. As shown in the next column of the figure, the null hypothesis is approximately true in some studies (i.e., the drug being tested has little or no effect), whereas it is false in others (i.e., the drug works well). In the particular numerical example of this figure, 10% of the studies tested false null hypotheses.
The “Study 1” column of the figure illustrates the results of the initial 1,000 studies. For the 900 studies in which the null was true, there should be about 45 positive results—that is, false positives—based on the standard α=.05 cut-off for statistical significance[1]. For the 100 studies in which the null was false, the number of positive results—that is, true positives—depends on the level of statistical power. Assuming the power level of 60% shown here, there should be about 60 true positives.[2]
It is illuminating—perhaps “alarming” would be a better word—to consider the implications of this model for the veracity of published findings in this research area. Given these values of the three parameters (i.e., α level, power, and base rate of false null hypotheses), publication of all positive findings would mean that 45/105 = 43% of the published findings would be false.
That value, called the “rate of false positives”, is obviously incompatible with the common presumption that published findings represent rock solid truth, but it emerges inevitably from these parameter values. Moreover, these parameter values are not outlandish; α=.05 is absolutely standard, statistical power=.60 is reasonable for many research areas, and so is a base rate of 10% false null hypotheses (e.g., 10% of drugs tested are effective).
Returning to the issue of replicability, the “Study 2” column of the figure shows what happens when researchers try to replicate the findings from the 45+60=105 positive outcomes from Study 1. If the replications use the same levels of α and power, on average only 2.25+36=38.25 replications will be successful. Thus, the expected overall replication probability[3] is 38.25/105=0.36. Again, this value is disturbingly low relative to the expectation that scientific findings should be consistently replicable, despite the fact that the parameter values assumed for this example are not wildly atypical.
It is also worth noting that the low replication probability obtained in Figure 1 results partly from the computation’s exclusive focus on positive results, as dictated by the standard definition of a “successful replication” stated earlier (i.e., a positive result in study 1 followed by a positive result in study 2).
Suppose instead that replication success was defined as getting the same result in Study 2 as in Study 1 (i.e., both studies got positive results or both got negative). To evaluate the probability of replication success under that revised definition, it would also be necessary to repeat each Study 1 that had negative results. If negative results were obtained again in these replication attempts, they would count as a successful replications under the revised definition. The replication probability would now jump to 87% (computations left as an exercise for the reader), which obviously sounds a lot better than the 36% computed under the standard definition.
Replication probability increases under the revised definition mostly because 95% of the 855 true negative Study 1 results would be replicated successfully in Study 2 (i.e., only 5% would produce non-replicating positive effects by chance). There is of course no inherently correct definition of “successful replication”, but it is worth keeping in mind that low replicabilities under the standard definition do not mean that few studies reach correct conclusions—only that many reports of positive findings may be wrong.
Expected replication probabilities with other parameter values
The 36% replication probability in Figure 1 is of course specific to the particular parameter values assumed for that example (i.e., the researchers’ α level, the power of their experiments, and the base rate of false null hypotheses). Using the same model, though, it is possible to compute the expected replication probability over a wide range of parameter values, and the results are illuminating.
Specifically, Figure 2 shows how the expected replication probability depends on the values of these three parameters when Study 2 power is the same as Study 1 power, as would be true in the case of exact replications of the original study, as diagrammed in Figure 1. Figure 3 shows the expected replication probabilities for the slightly different situation in which Study 2 power is much higher than it was in the original study—the Study 2 power value of 0.95 was used in these computations. Replicability with these “high power” replications is of interest because systematic studies of replicability (e.g., the above-cited studies producing the replicability estimates of 36%—62%) often increase sample sizes to obtain much higher power than was present in the original study.
 FIGURE 2. Replication probability, Pr(rep), as a function of α, power, and the base rate of false null hypotheses, computed using the model illustrated in Figure 1.
 FIGURE 3. High-power replication probability, Pr(rep), as a function of α, Study 1 power, and the base rate of false null hypotheses. These Pr(rep) values were computed under the assumption that Study 2 power is 0.95, regardless of Study 1 power.
The most striking finding in Figures 2 and 3 is simply that replication probabilities can be quite low. In each panel of Figure 2, for example, the replication probability is less than or equal to the individual power of each study. The panel’s power is the maximum possible replication probability, because it is the replication probability in the ideal case where there are no false positives. The maximum replication probabilities are much higher in Figure 3, because almost all true positives replicate when Study 2 power is 0.95. Nonetheless, within both figures some of the replication probabilities are far lower than is suggested by the expectation that scientific findings should be completely replicable. The implication is that we must either modify the research practices embodied in Figure 1 or else lower our expectations about the replicability of reported effects (cf. Stanley & Spence, 2014).
Another striking result in Figures 2 and 3 is that replication probability can drop to quite low rates when the base rate of false null hypotheses is low. The reason can be seen in the model of Figure 1. If most studies test true null hypotheses, then most of the positive results will be false positives, and these will be unlikely to replicate. As an extreme example, suppose that 999 of the 1,000 studies tested true null hypotheses. In that case at most one of the positive results could be a true positive. All the rest would necessarily be false positives, and the overall replication rate would necessarily be low. This would be true for any level of power and practically any level of α, so a low base rate of false null hypotheses will virtually always produce low replicability.
The implication, of course, is that one of the best ways to improve replicability is for researchers to avoid looking for “long shot” effects, instead requiring strong theoretical motivation before looking for effects (which, I presume, would increase the base rate). In fact, there are good reasons to believe that the temptation to test for long shots differs across research areas and that the resulting between-area differences in base rates are responsible for some of the between-area differences in replicability that have been reported (Wilson & Wixted, 2018).
Finally, Figures 2 and 3 also show that replication probability increases (a) as the α level decreases (e.g., from α=0.05 to α=0.005), and (b) as statistical power increases. These patterns reinforce calls for researchers to use lower α levels (e.g., Benjamin, Berger, Johannesson, et al., 2018) and to increase power (e.g., Button, Ioannidis, Mokrysz, et al., 2013).
Unfortunately, implementing these changes would be costly. For example, more than three times as much data are needed to run a study with α=0.005 and power=0.8, as compared with a study having α=0.05 and power=0.6. Assuming that data collection resources are limited, researchers would thus face the trade-off of choosing between, say, 10 of the larger studies (with higher replicability) or 30+ of the smaller studies (with lower replicability). This would clearly be a complicated choice that could be influenced by many factors. Using a cost-benefit analysis to quantify these trade-offs, Miller and Ulrich (2016, 2019) examined how researchers could make optimal choices (e.g., of α) to maximize overall scientific payoff, and they found—perhaps surprisingly—that under some circumstances the optimal choices would lead to replication probabilities under 50%.
Concluding comments
My presentation here was based on the de facto standard “null hypothesis testing” framework of statistical analysis shown in Table 1. Since that framework has often been criticized (for a relatively balanced discussion, see Nickerson, 2000—especially the esteemed colleague’s comment in footnote 2), some might wonder, “Could replication probabilities be improved by switching to a different framework (e.g., Bayesian)?”
Answering that question requires a precise formalization of the suggested alternative framework that is comparable to the framework shown in Figure 1, but my sense is that the answer is “no”. Regardless of which statistical criterion is used to decide whether an effect is present, Studies 1 and 2 will sometimes give conflicting results due to random variation. Moreover, there will be close analogs of the base rate, α level, and power parameters within any framework for making inferences about whether effects are present, and these new parameters will have pretty much the same influences on replication probability. For example, if the base rate of true effects is low, more of the seemingly positive Study 1’s effects will be false positives, and these effects will therefore be less replicable.
Thus, random variability in the data is the main factor limiting replicability—not the statistical methods used in their analysis. To be sure, improving the replicability of research is a worthwhile goal, but efforts in this direction should take into account the fundamental statistical limits on what is attainable.
Jeff Miller is Professor of Psychology at Otago University in New Zealand. His email address is miller@psy.otago.ac.nz.
[1] I have assumed that researchers use one-tailed hypothesis tests to simplify the computations. The overall pattern of results is quite similar if two-tailed tests are assumed.
[2] I have also assumed that all studies have the same statistical power to simplify the computations. The overall pattern of results is also quite similar if the indicated power level is the mean power of all studies, with the power levels of individual studies varying randomly—for example, with a beta distribution.
[3] It is reasonable to call this overall value an “aggregate replication probability” (Miller, 2009), because it is the overall probability of replication aggregating across all 105 different studies with initially positive findings. In contrast one might also conceive of an “individual replication probability” that would likely be of more interest to an individual researcher. This researcher, looking at the positive results of a specific Study 1, might ask, “If I repeat this study 100 times, about how often will I get significant results?” For the numerical example in the figure, the answer to that question is “either 5% or 60%, depending on whether the tested null hypothesis was actually false.” Note that no single researcher in this area would expect a long-term replication rate of 36%; instead the 36% value is an average for some researchers whose individual replication rates are 5% and others whose rates are 60%.
References
Asendorpf, J. B., Conner, M., De Fruyt, F., De Houwer, J., Denissen, J. J. A., et al. (2013). Recommendations for increasing replicability in psychology. European Journal of Personality, 27, 108–119. doi: 10.1002/per.1919
Baker, M. (2016). Is there a reproducibility crisis? Nature, 533, 452—454.
Benjamin, D. J., Berger, J. O., Johannesson, M., Nosek., B. A., Wagenmakers, E. J., Berk, R., et al. (2018). Redefine statistical significance. Nature Human Behaviour, 2, 6–10. doi: 10.1038/s41562-017-0189-z
Button, K. S., Ioannidis, J. P. A., Mokrysz, C., Nosek, B. A., Flint, J., Robinson, E. S. J. & Munafò, M. R. (2013). Power failure: Why small sample size undermines the reliability of neuroscience. Nature Reviews Neuroscience, 14(5), 365—376. doi: 10.1038/nrn3475
Camerer, C. F., Dreber, A., Holzmeister, F., Ho, T.-H., Huber, J. et al. (2018). Evaluating the replicability of social science experiments in Nature and Science between 2010 and 2015. Nature Human Behaviour, 2, 637—644. doi: 10.1038/s41562-018-0399-z
Fanelli, D. (2012). Negative results are disappearing from most disciplines and countries. Scientometrics, 90(3), 891—904. doi: 10.1007/s11192-011-0494-7
Miller, J. O. (2009). What is the probability of replicating a significant effect? Psychonomic Bulletin & Review, 16(4), 617—640. doi: 10.3758/PBR.16.4.617
Miller, J. O. & Schwarz, W. (2011). Aggregate and individual replication probability within an explicit model of the research process. Psychological Methods, 16(3), 337—360. doi: 10.1037/a0023347
Miller, J. O. & Ulrich, R. (2016). Optimizing research payoff. Perspectives on Psychological Science, 11 (5), 664—691. doi: 10.1177/1745691616649170
Miller, J. O. & Ulrich, R. (2019). The quest for an optimal alpha. PLOS ONE, 14 (1), 1—13. doi: 10.1371/journal.pone.0208631
Nickerson, R. S. (2000). Null hypothesis significance testing: A review of an old and continuing controversy. Psychological Methods, 5, 241—301. doi: 10.1037/1082-989X.5.2.241
Open Science Collaboration (2015). Estimating the reproducibility of psychological science. Science, 349(6251), aac4716-1—aac4716-8. doi: 10.1126/science.aac4716
Stanley, D. J. & Spence, J. R. (2014). Expectations for replications: Are yours realistic? Perspectives on Psychological Science, 9(3), 305—318. doi: 10.1177/1745691614528518
Wilson, B. M. & Wixted, J. T. (2018). The prior odds of testing a true effect in cognitive and social psychology. Advances in Methods and Practices in Psychological Science, 1 (2), 186—197. doi: 10.1177/2515245918767122

You must be logged in to post a comment.