Picking Significant Estimates to Replicate Can Induce “Replication Crisis”-Like Results
[From the paper “Statistical Methods for Replicability Assessment” by Kenneth Hung and William Fithian, posted at ArXiv.org. Note that H&K’s paper is primarily concerned with presenting an empirical procedure for addressing questions about replicability after correcting for selection bias. This post highlights their observation about the importance of selection bias in interpreting replication results.]
“While concerns about replicability cut across scientific disciplines, psychologists have led large-scale efforts to assess the replicability of their own field. The largest and most systematic of these efforts has been the Reproducibility Project: Psychology (RP:P), a major collaboration by several hundred psychologists to replicate a representative sample of 100 studies published in 2008 in three top psychology journals.”
“Open Science Collaboration (OSC; 2015) reported three main metrics: it found that 64% (= 1 − 36%) of the replication studies did not find statistically significant results in the same direction as the original studies, that 53% (= 1 − 47%) of 95% confidence intervals for the replication studies do not contain the point estimates for their corresponding original studies, and that 83% of the effect size estimates declined from original studies to replications. All three summary statistics were widely reported as indicating a dire crisis for the credibility of experimental psychology research.”
“…none of the three reported metrics can be taken at face value as estimates of the answers to the corresponding questions, due to the confounding factor of pervasive selection bias.”
“The RP:P data shows unmistakable signs of selection for statistically significant findings in the original experiments: 91 of the 100 results replicated by OSC were statistically significant at the 0.05 level in the original study and four of the others had “marginally significant” p-values between 0.05 and 0.06.”
“This is due partly to publication bias (that the studies might not have been published, or the results discussed, if the p-values had not been significant), but also partly to OSC’s method for choosing which results to replicate. Each OSC replication team selected a “key result” from the last experiment presented in the original paper, and evidently most teams chose a significant finding as the key result (justifiably so, since positive results usually draw the most attention from journal readers and the outside world).”
“The resulting selection bias in the original studies leads to many well-known and predictable pathologies, such as systematically inflated effect size estimates, undercoverage of (unadjusted) confidence intervals, and misleading answers from unadjusted meta-analyses. Indeed, most of the phenomena reported by OSC, including the three metrics discussed above, could easily be produced by selection bias alone.”
“Consider a stylized setting where all experiments (both original and replication) have an identical effect size θ, producing an unbiased Gaussian estimate with standard error 1. Assume, however, that we observe only study pairs for which the original study is significant at level 0.05.”
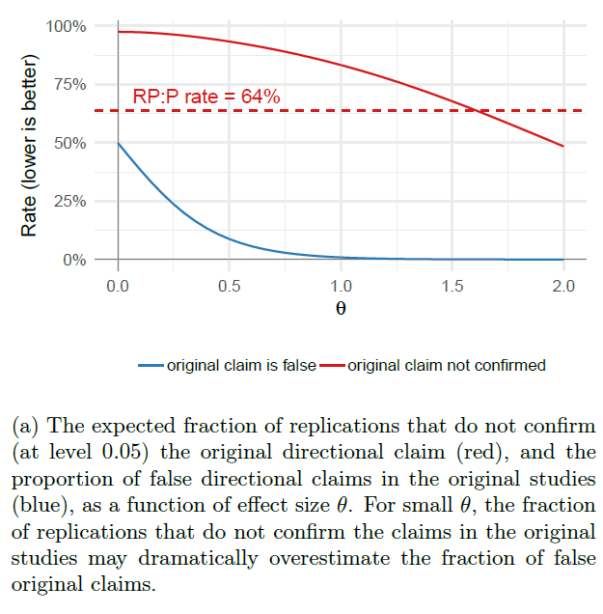
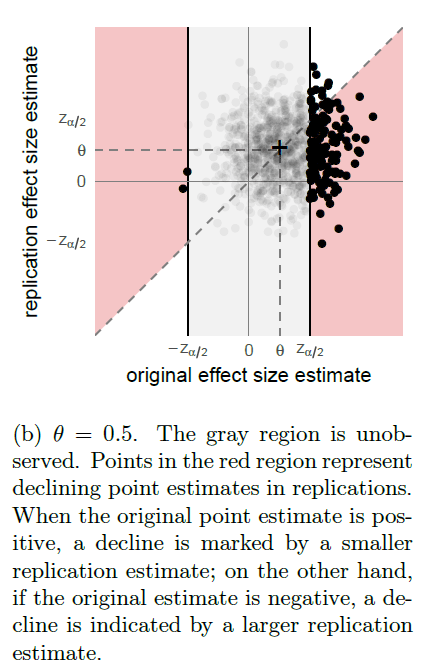
“Figure 2a shows the expected fraction of replication studies which are not statistically significant in the same direction as the corresponding original studies, as a function of effect size θ, along with the true proportion of false directional claims; or type S errors. Even when the true error rate is low, e.g. at θ = 1 as shown in Figure 2b, the proportion of replications reporting the same directional findings as the original studies can remain low.”
FIGURE 2

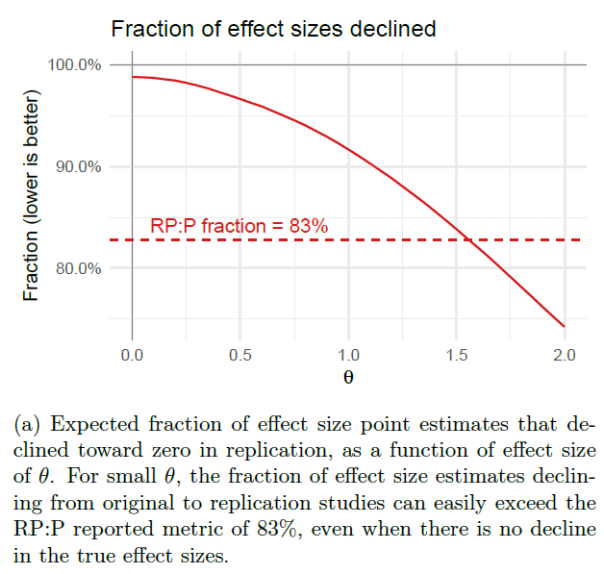
“Likewise, we simulate the expected fraction of 95% replication confidence intervals that fail to cover their original point estimates in Figure 3 and the expected fraction of effect sizes that decline in Figure 4. In both cases, we see that selection bias is more than sufficient to produce the metrics in RP:P, even in our idealized simulation with exact replications and relatively few type S errors.”
FIGURE 3
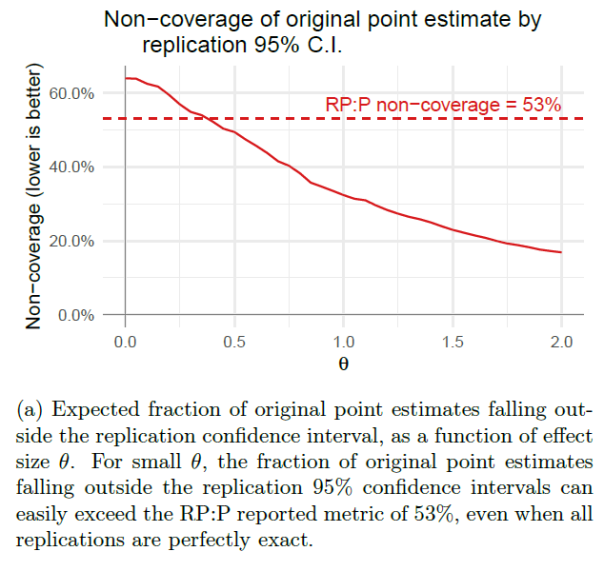

FIGURE 4
“Because selection bias could, in principle, provide a sufficient explanation for the metrics reported in RP:P, those metrics do not, in and of themselves, provide any evidence of any other problems. In particular, they shed no light on whether the FDR is actually high, or how much the effect sizes shifted, or whether effect sizes tend to decline. Nor do they provide evidence for any competing accounts of the replication crisis, such as QRPs like p-hacking, high between-study variability in effect sizes, or systematic biases in the original studies.”
To read the article, click here.

You must be logged in to post a comment.