[Excerpts are taken from the blog “Evidence of Fraud in an Influential Field Experiment About Dishonesty” posted by Uri Simonsohn, Joe Simmons, Leif Nelson and anonymous researchers at Data Colada]
“This post is co-authored with a team of researchers who have chosen to remain anonymous. They uncovered most of the evidence reported in this post.”
“In 2012, Shu, Mazar, Gino, Ariely, and Bazerman published a three-study paper in PNAS reporting that dishonesty can be reduced by asking people to sign a statement of honest intent before providing information (i.e., at the top of a document) rather than after providing information (i.e., at the bottom of a document).”
“In 2020, Kristal, Whillans, and the five original authors published a follow-up in PNAS entitled, “Signing at the beginning versus at the end does not decrease dishonesty”.
“Our focus here is on Study 3 in the 2012 paper, a field experiment (N = 13,488) conducted by an auto insurance company … under the supervision of the fourth author. Customers were asked to report the current odometer reading of up to four cars covered by their policy.”
“The authors of the 2020 paper did not attempt to replicate that field experiment, but they did discover an anomaly in the data…our story really starts from here, thanks to the authors of the 2020 paper, who posted the data of their replication attempts and the data from the original 2012 paper.”
“A team of anonymous researchers downloaded it, and discovered … very strong evidence that the data were fabricated.”
“Let’s start by describing the data file. Below is a screenshot of the first 12 observations:”

“You can see variables representing the experimental condition, a masked policy number, and two sets of mileages for up to four cars. The “baseline_car[x]” columns contain the mileage that had been previously reported for the vehicle x (at Time 1), and the “update_car[x]” columns show the mileage reported on the form that was used in this experiment (at Time 2).”
“On to the anomalies.”
Anomaly #1: Implausible Distribution of Miles Driven
“Let’s first think about what the distribution of miles driven should look like…we might expect…some people drive a whole lot, some people drive very little, and most people drive a moderate amount.”
“As noted by the authors of the 2012 paper, it is unknown how much time elapsed between the baseline period (Time 1) and their experiment (Time 2), and it was reportedly different for different customers. … It is therefore hard to know what the distribution of miles driven should look like in those data.”
“It is not hard, however, to know what it should not look like. It should not look like this:”
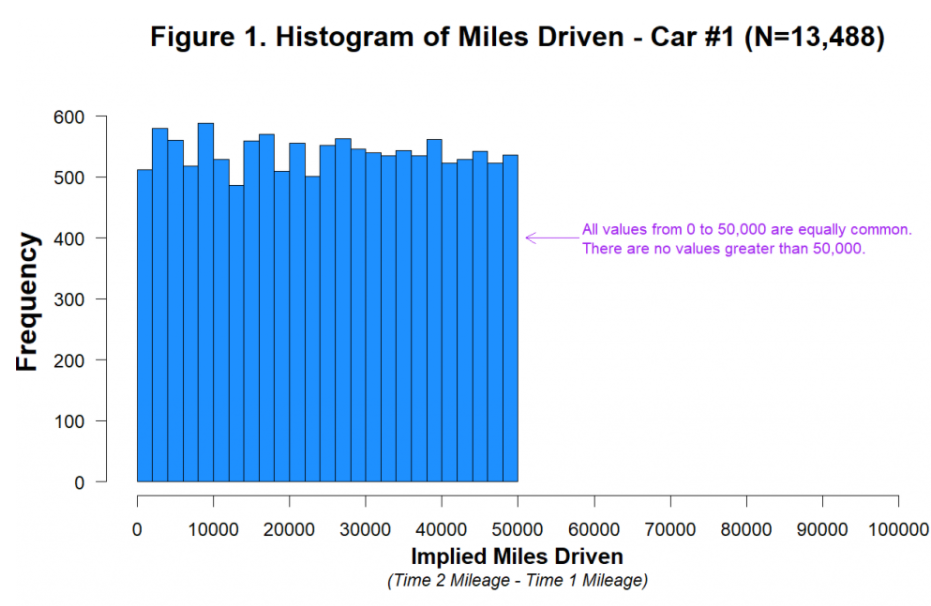
“First, it is visually and statistically (p=.84) indistinguishable from a uniform distribution ranging from 0 miles to 50,000 miles. Think about what that means. Between Time 1 and Time 2, just as many people drove 40,000 miles as drove 20,000 as drove 10,000 as drove 1,000 as drove 500 miles, etc. This is not what real data look like, and we can’t think of a plausible benign explanation for it.”
“Second, there is some weird stuff happening with rounding…”
Anomaly #2: No Rounded Mileages At Time 2
“The mileages reported in this experiment … are what people wrote down on a piece of paper. And when real people report large numbers by hand, they tend to round them.”
“Of course, in this case some customers may have looked at their odometer and reported exactly what it displayed. But undoubtedly many would have ballparked it and reported a round number.”
“In fact, as we are about to show you, in the baseline (Time 1) data, there are lots of rounded values.”
“But random number generators don’t round. And so if, as we suspect, the experimental (Time 2) data were generated with the aid of a random number generator (like RANDBETWEEN(0,50000)), the Time 2 mileage data would not be rounded.”

“The figure shows that while multiples of 1,000 and 100 were disproportionately common in the Time 1 data, they weren’t more common than other numbers in the Time 2 data.”
“These data are consistent with the hypothesis that a random number generator was used to create the Time 2 data.”
“In the next section we will see that even the Time 1 data were tampered with.”
Interlude: Calibri and Cambria
“Perhaps the most peculiar feature of the dataset is the fact that the baseline data for Car #1 in the posted Excel file appears in two different fonts. Specifically, half of the data in that column are printed in Calibri, and half are printed in Cambria.”
“The analyses we have performed on these two fonts provide evidence of a rather specific form of data tampering.”
“We believe the dataset began with the observations in Calibri font. Those were then duplicated using Cambria font. In that process, a random number from 0 to 1,000 (e.g., RANDBETWEEN(0,1000)) was added to the baseline (Time 1) mileage of each car, perhaps to mask the duplication.”
“In the next two sections, we review the evidence for this particular form of data tampering.”
Anomaly #3: Near-Duplicate Calibri and Cambria Observations
“…the baseline mileages for Car #1 appear in Calibri font for 6,744 customers in the dataset and Cambria font for 6,744 customers in the dataset. So exactly half are in one font, and half are in the other. For the other three cars, there is an odd number of observations, such that the split between Cambria and Calibri is off by exactly one (e.g., there are 2,825 Calibri rows and 2,824 Cambria rows for Car #2).”
“… each observation in Calibri tends to match an observation in Cambria.”
“To understand what we mean by “match” take a look at these two customers:”

“The top customer has a “baseline_car1” mileage written in Calibri, whereas the bottom’s is written in Cambria. For all four cars, these two customers have extremely similar baseline mileages.”
“Indeed, in all four cases, the Cambria’s baseline mileage is (1) greater than the Calibri mileage, and (2) within 1,000 miles of the Calibri mileage. Before the experiment, these two customers were like driving twins.”
“Obviously, if this were the only pair of driving twins in a dataset of more than 13,000 observations, it would not be worth commenting on. But it is not the only pair.”
“There are 22 four-car Calibri customers in the dataset. All of them have a Cambria driving twin…there are twins throughout the data, and you can easily identify them for three-car, two-car, and unusual one-car customers, too.”
“To see a fuller picture of just how similar these Calibri and Cambria customers are, take a look at Figure 5, which shows the cumulative distributions of baseline miles for Car #1 and Car #4.”
“Within each panel, there are two lines, one for the Calibri distribution and one for the Cambria distribution. The lines are so on top of each other that it is easy to miss the fact that there are two of them:”

Anomaly #4: No Rounding in Cambria Observations
“As mentioned above, we believe that a random number between 0 and 1,000 was added to the Calibri baseline mileages to generate the Cambria baseline mileages. And as we have seen before, this process would predict that the Calibri mileages are rounded, but that the Cambria mileages are not.”
“This is indeed what we observe:”

Conclusion
“The evidence presented in this post indicates that the data underwent at least two forms of fabrication: (1) many Time 1 data points were duplicated and then slightly altered (using a random number generator) to create additional observations, and (2) all of the Time 2 data were created using a random number generator that capped miles driven, the key dependent variable, at 50,000 miles.”
“We have worked on enough fraud cases in the last decade to know that scientific fraud is more common than is convenient to believe… There will never be a perfect solution, but there is an obvious step to take: Data should be posted.”
“The fabrication in this paper was discovered because the data were posted. If more data were posted, fraud would be easier to catch. And if fraud is easier to catch, some potential fraudsters may be more reluctant to do it. … All of our journals should require data posting.”
“Until that day comes, all of us have a role to play. As authors (and co-authors), we should always make all of our data publicly available. And as editors and reviewers, we can ask for data during the review process, or turn down requests to review papers that do not make their data available.”
“A field that ignores the problem of fraud, or pretends that it does not exist, risks losing its credibility. And deservedly so.”
To read the full blog, click here.

You must be logged in to post a comment.