VAN BERGEIJK: What a Difference a Data Version Makes
Data sources are regularly updated. Users typically assume that this means that new, more recent data are added and that errors are corrected. Newer data are better. But are they? And what are the implications for replication? This guest blog points out challenges and potential benefits of the existence of different data versions.
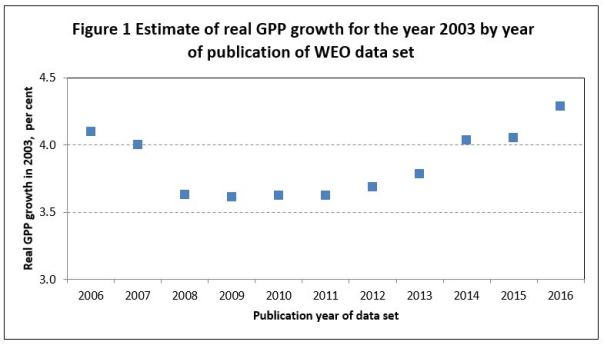
Often unnoticed, economic history is constantly being rewritten. This results in different vintages or versions of data. By way of illustration Figure 1 reports the real rate of growth of GPP (Gross Planet Product; see van Bergeijk 2013) for the year 2003. The 11 data versions have been reported in 2006-2016 alongside the IMF flagship publication World Economic Outlook (the so-called October version). The lowest number reported for 2003 was published in 2009 (3.61%). The highest value for the 2003 growth rate (4.29%) was published in 2016. The reported growth rate for the year 2003 varies thus by 0.68 percentage points between the different data versions. This is an economically relevant difference of 16 to 19% depending on whether one uses the highest or lowest growth rate to calculate the percentage.
Revising without and with transparency
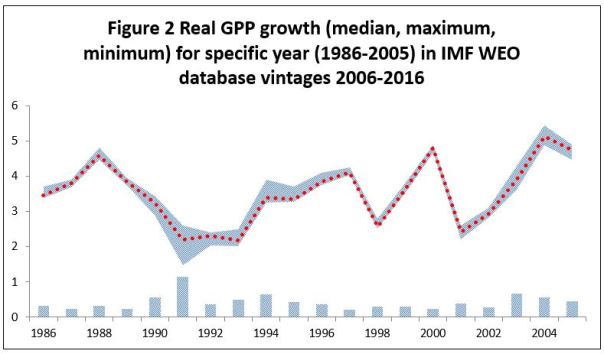
Figure 2 illustrates that this variation for historical data is a regular phenomenon in the IMF World Economic Outlook data base. Using the same 11 data versions above, the figure reports the minimum and maximum (bar and grey area) and the median GPP growth rate (dotted line) for the years 1986-2005. Consider the different GPP growth rates reported for the year 1991 across the different vintages. Despite the fact that all the data vintages were published at least 25 years after the event, the variation in reported GPP values for 1991 differ by as much as 1.1 percentage points (or 50% of the median value). While this is the largest variation in the figure, several of the ‘revisions’ for other years are also substantial.
The IMF’s opaqueness is perhaps exceptional. Other leading data sources such as the World Bank’s World Development Indicators or the Penn World Tables do report changes in methodology, estimates and underlying series transparently and in detail. The point is that these data that are used on a daily basis by many analysts and researchers are likely to change after an analysis has been done and published.
Challenges for replication research
Obviously the constant rewriting of historical data is a challenge for replication. For exact replication it is important to know which version of data was used. Although many authors report the data source, the version and the date accessed, other scientists may only report the source and, possibly, year of publication. In order to undertake an exact replication, replicating authors may need to contact authors of the original studies in order to use the identical vintage. For replication designs that want to test if the reported findings continue to hold for longer time spans (and include more recent data) a de-composition may be necessary to find out what part of the estimated effect is due to the new vintage and what to the more recent data.
Potential benefits for replication research
Variations between the different vintages of a data set are not necessarily problematic. Variations provide insight in the measurement error in the data source. A better understanding of measurement error may be helpful for establishing why a replication fails or succeeds. Moreover, performing replications over many different vintages can support the robustness of the original study’s findings. If all the data versions arrive at the same conclusion, this strengthens confidence in the replication’s verdict on the original study (be it positive or negative). It is not the difference of the data version that matters, but the similarity of findings across different data versions. As a result, different data versions can be turned into an important asset for replication research.
Reference
Bergeijk, P.A.G. van, Earth Economics: An Introduction to Demand Management, Long-Run Growth and Global Economic Governance, Edward Elgar: Cheltenham, 2013
Peter A.G. van Bergeijk is professor of international economics and macroeconomics at the Institute of Social Studies, Erasmus University. More information can be found here: http://www.petervanbergeijk.org/.

You must be logged in to post a comment.