REED: EIR* – Interval Testing
[* EIR = Econometrics in Replications, a feature of TRN that highlights useful econometrics procedures for re-analysing existing research. The material for this blog is motivated by a recent blog at TRN, “The problem isn’t just the p-value, it’s also the point-null hypothesis!” by Jae Kim and Andrew Robinson]
In a recent blog, Jae Kim and Andrew Robinson highlight key points from their recent paper, “Interval-Based Hypothesis Testing and Its Applications to Economics and Finance” (Econometrics, 2019). They identify three problems with conventional null hypothesis significance testing (NHST) based on p-values.
First, the p-value does not convey any information about the economic significance of the estimated effect.
Second, the p-value is decreasing in sample size for the same measured effect so that at a sufficiently large sample size, virtually everything is “statistically significant”.
Third, the null hypothesis is almost always wrong, as it unlikely in the extreme that a particular effect is truly 0.000000000…
As an alternative, they promote the use of interval-based hypothesis testing. In particular, they advance two types of interval tests: Minimum Effect Tests (MET) and Equivalence Tests (ET).
The idea behind the two tests is similar. In both cases, the researcher posits limits for a given effect. Say, in the judgment of the researcher, any effect that lies between value1 and value 2 is too small to be economically important. Only values outside this range are economically meaningful.
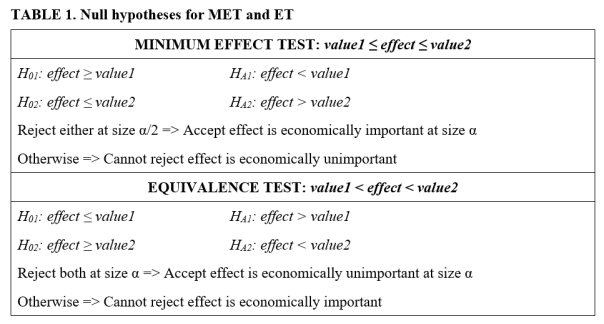
With Minimum Effect Tests, the aim is to determine if value1 ≤ effect ≤ value2. Hypothesis testing consists of two, one-sided hypothesis tests (TOST). H01: effect ≥ value1, and H02: effect ≤ value2. Rejection of either hypothesis leads to the conclusion that the effect is economically important. Otherwise one cannot reject the hypothesis that the effect is economically unimportant. The size of the MET test is the sum of the sizes of the two separate, one-sided t-tests.
With Equivalence Tests, the aim is to determine if value1 < effect < value2. Hypothesis testing again consists of two, albeit different, one-sided hypothesis tests (TOST): H01: effect ≤ value1 and H02: effect ≥ value2. Rejection of both hypotheses leads to the conclusion that the effect is economically unimportant. Otherwise one cannot reject the hypothesis that the effect is economically important. The size of the ET is the same as the size of the individual one-sided tests (which typically are of equal size).
This is summarized in the table below:
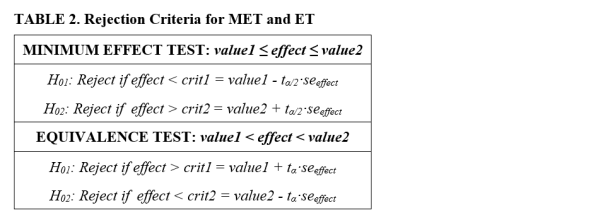
Given the above, it follows that the respective rejection criteria, expressed in terms of t-tests, are as reported in the table below.
While similar, the two tests are designed for different purposes. Minimum Effect Tests are designed to test for economic importance, while Equivalence Tests are designed to test for lack of economic importance. Rejection of the respective null hypotheses allows one to accept the economic status for which the researcher is seeking evidence. This also means that the tests can lead to seemingly conflicting conclusions.
The remainder of this blog presents two examples to illustrate how to implement and interpret interval testing. In both examples, we envision an experiment with two groups, a treatment and a control group. The data generating process (DGP) used to produce the data is given by y = β·treat + error, where treat is a binary treatment variable that takes the value 1 if the subject received the treatment and 0 otherwise.
The examples are constructed so that in both cases the coefficient on the treat variable is statistically significant. Interval testing is used to determine whether the treatment effect is economically meaningful. To determine “economic importance”, we convert the estimated treatment effect to Cohen’s d, a familiar metric for measuring effect sizes when comparing means between two groups. Following the example of Lakens (2017), we interpret values of Cohen’s d less than 0.3 in absolute value to be economically unimportant.
Example One
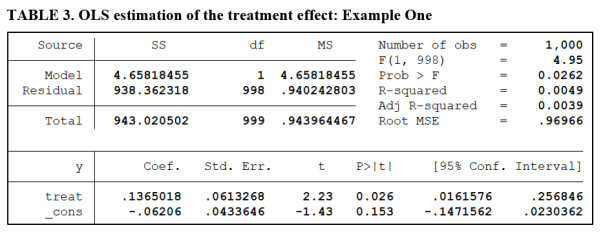
The regression below reports the results of regressing the outcome variable y on the treatment dummy variable. 500 subjects receive the treatment, with another 500 held out for the control group. The treatment effect is significant at the 5% level, with a t-value of 2.23 (see below).
To implement interval testing, we test for differences in the means of the two groups, calculate Cohen’s d, and then carry out the respective tests of hypotheses as presented in Tables 1 and 2. The first example is constructed so that both the Minimum Effect Test and the Equivalence Test produce a similar conclusion. Table 4A reports the results for the MET.
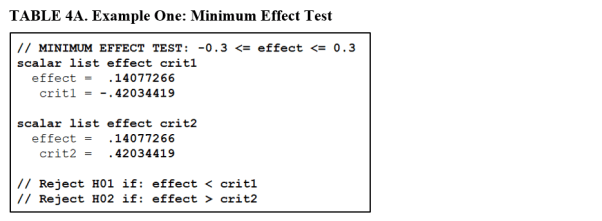
The estimated effect (Cohen’s d) is 0.14. The lower and upper critical values are ±0.42. We fail to reject both H01 and H02 for the Minimum Effect Test. According to Table 1, this leads to the conclusion that we cannot reject the hypothesis that the treatment effect is economically unimportant.
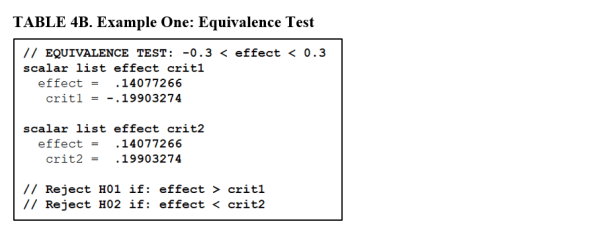
TABLE 4B reports the results of an Equivalence Test applied to the same data. Now we compare the Cohen’s d value of 0.14 to the critical values ±0.20. Accordingly, we reject both null hypotheses. This allows us to accept the hypothesis, at the 5% significance level, that the treatment does not have an economically important effect.
In this example, both tests lead to similar conclusions. However, there is an important difference. The Equivalence Test is the stronger result in that we accept the hypothesis of economic unimportance. The Minimum Effect Test is weaker, in that we only fail to reject the hypothesis that it is unimportant.
Example Two
In this example, we construct the DGP so that we still obtain a significant treatment effect. However, the associated tests will lead to seemingly conflicting conclusions.
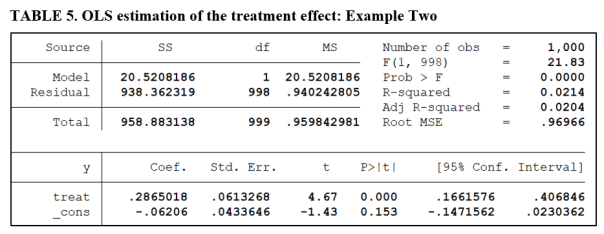
Table 5 gives the OLS regression estimate of the treatment effect. The treatment effect is highly significant, with a t-value of 4.67 (see below).
Tables 6A and 6B report the results of the Minimum Effect and Equivalence Tests.
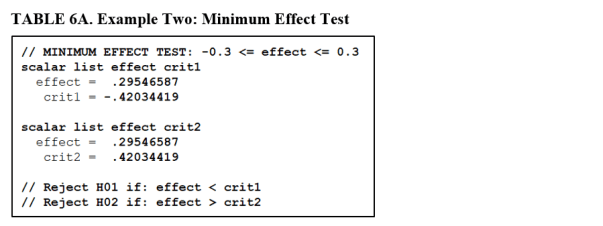
The estimated effect (Cohen’s d) is now 0.295, very close to our threshold of economic significance (0.30). The lower and upper critical values remain at their values from the first example (±0.42). A comparison of the estimated effect with the respective critical values confirms that we fail to reject both H01 and H02 for the Minimum Effect Test. This leads to the conclusion that we cannot reject the hypothesis that the treatment effect is economically unimportant.
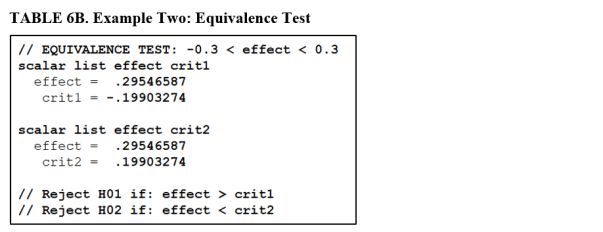
Table 6B performs an Equivalence Test on the same data. Now we compare the Cohen’s d value of 0.295 with the critical values ±0.20. We reject H01 but not H02. Accordingly, we cannot reject the hypothesis that the treatment effect is economically important.
In this example, the different tests lead to seemingly conflicting conclusions. The conflict derives from the fact that both tests produced weak conclusions. We could neither reject the hypothesis that the treatment effect was economically unimportant, nor reject the hypothesis that it was important.
In conclusion, interval testing addresses a shortcoming of NHST in that it allows us to address issues of economic importance, something that NHST is ill-equipped to do. However, it does require the researcher to declare a range of values for the effect that are deemed “economically unimportant”. Not all researchers may agree with the researcher’s choice of values.
Further, both Minimum Effect and Equivalence Tests share the weakness of all hypothesis testing in that conclusions of “Failure to reject” are weak results with respect to discriminating between null and alternative hypotheses.
*NOTE: The programming code (Stata) necessary to reproduce the results for the two examples in this blog are available at Harvard’s Dataverse: click here. Feel free to check it out and play around with the simulation parameters to produce different examples.]
Bob Reed is a professor of economics at the University of Canterbury in New Zealand. He is also co-organizer of the blogsite The Replication Network. He can be contacted at bob.reed@canterbury.ac.nz.

You must be logged in to post a comment.