NOTE: This is a another long blog. Sorry about that! TL;DR: I provide a common framework for evaluating 5 recent papers and critically compare them. All of the papers have shortcomings. I argue that the view that the psychology papers represent a kind of “gold standard” is not justified. There is a lot left to learn on this subject.
In a previous post, I summarized 5 recent papers that attempt to estimate the causal effect of a negative replication on the original study’s citations. In this blog, I want to look a little more closely at how each of the papers attempted to do that.
Because the three psychology papers utilized replications that were “randomly” selected (more on this below), there is the presumption that their estimates are more reliable. I want to challenge that view. In addition, I want to reiterate some concerns that have been raised by others that I think have not been fully appreciated.
I also think it is insightful to provide a common framework for comparing and assessing the 5 papers. As I am a co-author on one of those papers, I will attempt to avoid letting my bias affect my judgment, but caveat lector!
DID and the Importance of the Parallel Trends Assumption
The three psychology papers — Serra-Garcia & Gneezy (2021), Schafmeister (2021), and von Hippel (2022) – all employ a Difference-in-Difference (DID) identification strategy that relies on the assumption of parallel trends (PT). (Von Hippel also employs an alternative strategy that does not assume PT, but more on that below.) Before looking at the papers more closely, it is good to refresh ourselves on the importance of the PT assumption in DID estimation.
FIGURE 1 below shows trends in citations for studies that had failed replications (black line) and studies that had successful replications (blue line). The treatment is revelation of the outcome of the respective replications (failed replication, successful replication), and the start time of the treatment is the date that the replication was published, T*.
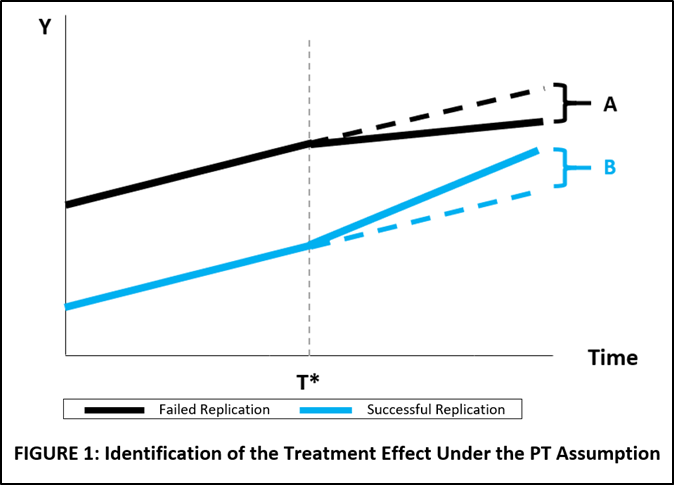
A researcher wants to estimate the citation effect of failed versus successful replications. The solid lines represent the observed citation trends of the original studies before and after the treatment. For the counterfactuals, the researcher assumes that the pre-treatment trends would have continued had the studies not been replicated. This is represented by the black and blue dotted lines, respectively.
In the figure, failed replications result in fewer citations per year, represented by the flatter slope of the black line. The associated treatment effect of failed replications is the difference in slopes between the actual trend line and the counterfactual trend line, given by A, where A < 0.
Successful replications result in more citations per year, represented by the steeper slope of the blue line. The treatment effect for positive replications is again the difference in slopes, given by B, where B > 0.
The estimate of the total citation effect of a failed replication versus a successful replication is given by (A-B).
The importance of the PT assumption is illustrated in FIGURE 2. Here, originals with failed replications have a steeper trend in the pre-treatment period than originals with successful replications.
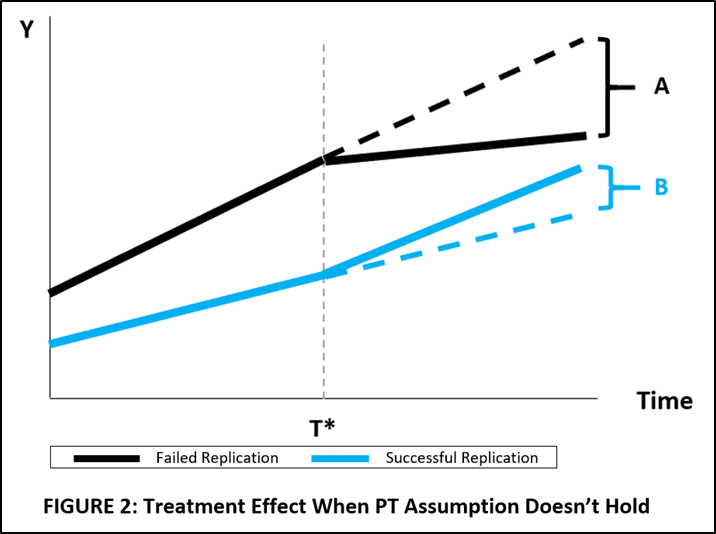
If the researcher were to mistakenly assume that they had the same trend, say use the average of the pre-treatment trends, they would underestimate both A and B, and thus underestimate the effect of a failed replication versus a successful replication.
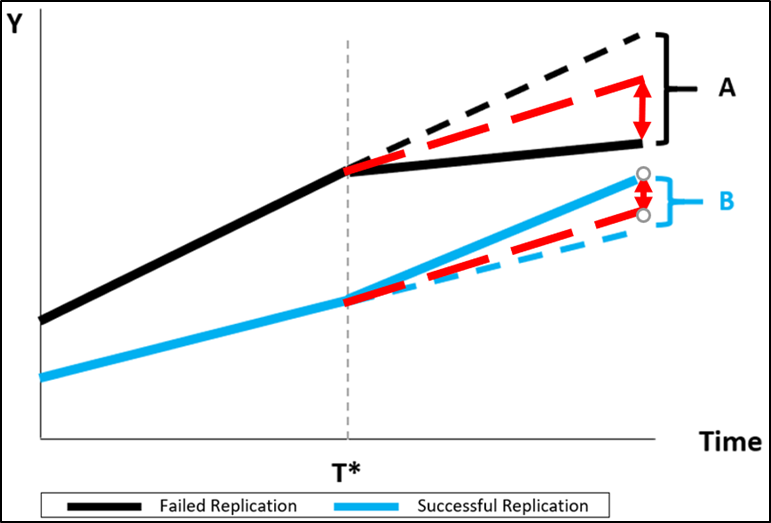
This is illustrated below. The red line averages the pre-treatment trends of studies with failed replications and studies with successful replications.
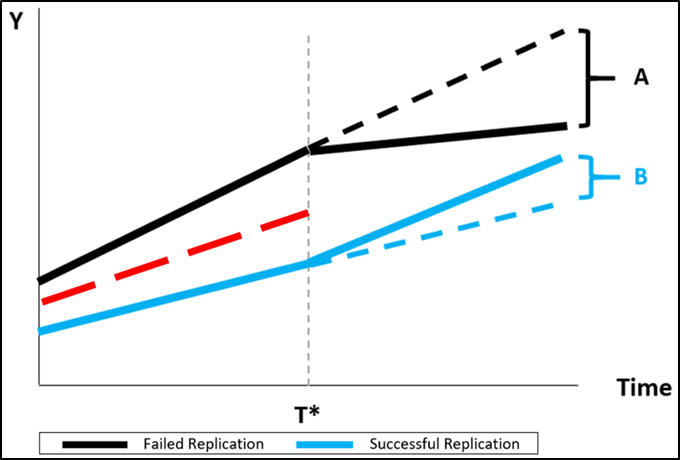
When the averaged, common trend is used to establish the respective counterfactuals, both |A| and |B| are underestimated, so that the total citation effect of a failed replication versus a successful replication is underestimated. This is illustrated by the dotted red lines below.
How the PT Assumption is Incorporated in Regression Specifications
Now I show how the three studies incorporate the PT assumption in their regressions.
Serra-Garcia & Gneezy:
(1) Yit = β0i + β1Successit + β2AfterReplicationit+ β3Success×AfterReplicationit+ Year Fixed Effects + Control Variables
Schafmeister:
(2) Yit = β0 + β1Successfulit + β2Failedit+ Study Fixed Effects + Year Fixed Effects + Control Variables
Von Hippel:
(3) Yit = β0 + β1AfterFailureit + Study Fixed Effects + Year Fixed Effects + Control Variables
In the equations above, Yit represents citations of study i in year t. The estimate of the citation penalty for failed versus successful replications is respectively given by β3 (Equation 1), β2 – β1 (Equation 2), and β1 (Equation 3).
While the three specifications have some differences, all three equations include a common time trend for both failed and successful replications, represented by “Year Fixed Effects”. This imposes the PT assumption on the estimating equations.
What is the Basis for the PT Assumption?
My reading of the respective articles is that each of them depends, explicitly or implicitly, on the research design of the Reproducibility Project: Psychology (RPP) and the related Camerer et al. (2016, 2018) studies to support the assumption of PT.
As discussed in my prior blog, RPP “randomly” selected which experiments to replicate, without regard to whether they thought the replications would be successful. As such, one could argue that there is no reason to expect pre-treatment citation trends to differ, since there was nothing about the original studies that affected the choice to replicate.
However, random selection of experiments does not mean random assignment of outcomes. As was first pointed out to me by Paul von Hippel, just because the choice of articles to replicate was “random” does not mean that the assignment of treatments (failed/successful replications) to citation trends will be random. There could well be features of studies that affect both their likelihood of being successfully replicated and their likelihood of being cited.
In fact, this is exactly the main point of Serra-Garcia & Gneezy’s article “Nonreplicable publications are cited more than replicable ones.” They show that nonreplicable papers were cited more frequently EVEN BEFORE it was demonstrated they were nonreplicable.
Serra-Garcia & Gneezy have an explanation for this: “Existing evidence … shows that experts predict well which papers will be replicated. Given this prediction, why are nonreplicable papers accepted for publication in the first place? A possible answer is that the review team faces a trade-off. When the results are more “interesting,” they apply lower standards regarding their reproducibility.” In other words, “interesting-ness” is a confounder for both pre-treatment citations and replicability.
FIGURE 3 from their paper (reproduced below) supports scepticism about the PT assumption. It shows pre-treatment citation trends for three sets of replicated studies. For two of them “Nature/Science” and “Psychology in rep. markets” (which corresponds to the RPP), the citation trends for original studies with failed replications show substantially higher rates of citation before treatment than those with successful replications. This is a direct violation of the PT assumption.

In personal correspondence about my paper with Tom Coupé (discussed below), one researcher wrote me, “I would be worried about selection bias—which papers were chosen (by others) for replication? [A] ‘trick’ to avoid selection [is] to base [your] study on papers that were replicated systematically (‘ALL experimental papers in journal X for the year Y’).” As should be clear from the above, studies that rely on replications from RPP and the Camerer et al. studies are not beyond criticism on this regard.
But wait, there’s more!
Tom Hardwicke, who has also examined the effect of failed replications on citations (Hardwicke et al., 2021), pointed out to me two other issues. Underlying the citation analyses of the RPP replications is the assumption that once RPP was published, readers were immediately made aware of the non-replicability of the respective studies.
Not so fast. It is not easy to identify the studies that failed replication in RPP. They are not listed in the paper. And they are not listed in the supplementary documentation. To find them, you have to go back to the original RPP spreadsheet that contains their data. Even assuming one made it that far, identifying the studies that failed replication is not so easy. Don’t take my word for it. Check it out yourself here.
Even assuming that one identified which studies failed replication, there is the question of whether the evidence was strong enough to change one’s views about the original study. Etz & Vandekerckhove (2021) concluded that it did not: “Overall, 75% of studies gave qualitatively similar results in terms of the amount of evidence provided. However, the evidence was often weak (i.e., Bayes factor < 10). The majority of the studies (64%) did not provide strong evidence for either the null or the alternative hypothesis in either the original or the replication, and no replication attempts provided strong evidence in favor of the null.”
Where does Ankel-Peters, Fiala, and Neubauer fit within the DID framework?
Before moving on to strategies that do not rely on the PT assumption, it is helpful to place Ankel-Peters, Fiala, and Neubauer (2023) in the context of the analysis above. Their main argument is represented by FIGURE 6 from their paper, reproduced below. The black line is the citations trend of original papers whose replications failed.
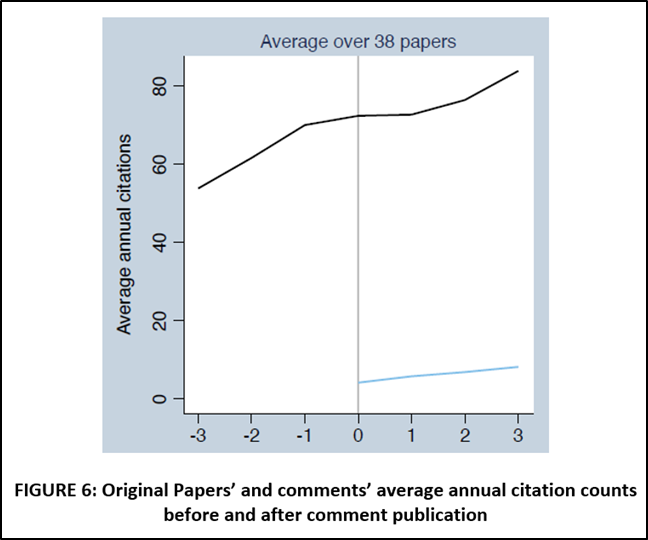
While they do not report this in their paper, my own analysis of AER “Comments” is that the AER rarely, very rarely, publishes successful replications. Given that almost all the replications in their dataset are failed replication, their paper can be understood as estimating the treatment effect exclusively from the solid black line in FIGURES 1 and 2; i.e., no dotted lines, no blue lines.
No PT Assumption: Approach #1
Of the 5 papers reviewed here, only two provide citation effect estimates without invoking the PT assumption. In addition to the model presented above, von Hippel estimates something he calls the “lagged model”:
(4) ln(YI,t>2015) = β0 + β1 ln(YI,t<2015) + β2 Failurei + β3 ln(YI,t<2015) x Failurei
where YI,t>2015 and YI,t<2015 are the total citations received by original study i in the years before and after the RPP replications were published in 2015. Despite its apparent similarity with a DID, the “treatment variable” in Equation (4) is NOT represented by the interaction term. The treatment effect is given by β2. The interaction term allows the citation trend for original studies with failed replications to have a different “slope” than those with successful replications.
No PT Assumption: Approach #2
Last but not least (there’s my bias slipping in!) is Coupé and Reed (2023). As discussed in the previous blog, they use a matching strategy to join the original studies with studies that have not been replicated but have near identical, pre-treatment citation histories. This identification strategy is easily placed within FIGURE 2.
Consider first original studies with failed replications. Since each of these is matched with control studies with near identical pre-treatment citation histories, one can think of two citation trends that lie on top of each other in the pre-treatment period. Accordingly, the solid black line in FIGURE 2 in the period T < T* now represents citation trends for both the original studies and their matched controls. Once we enter the post-treatment period, the two citation trends diverge.
The solid black line in the period T > T* represents the citation trend for the studies with failed replications after the results of the replication have been published. The dotted black line is the observed citation trend of the matched controls, which serve as the counterfactual for the original studies. The difference in slopes represents the treatment effect of a failed replication.
The same story applies to the studies with successful replications, which are now represented by the blue line in FIGURE 2. Note that the black and blue lines are allowed to have different, pre-treatment slopes. Thus Coupé & Reed’s matching strategies, like von Hippel’s lagged model, avoids imposing the PT assumption.
Coupé and Reed’s approach is not entirely free from potential problems. Because the replications were not selected “randomly”, there is concern that their approach may suffer from sample selection. However, the sample selection is not the obvious one of replicators choosing highly-cited papers that they think will fail because that brings them the most attention. That sample selection is addressed by matching on the pre-treatment citation history.
Rather, the concern is that even after controlling for identical pre-treatment citation histories, there remains some unobserved factor that (i) causes original studies and their matched controls to diverge after a replication has been published and (ii) is spuriously correlated with whether a paper has been successfully replicated. Having acknowledged that possibility, it’s not clear what that unobserved factor could be.
Summary
There is no silver bullet when it comes to identifying the citation effect of failed replications. Criticisms can be levelled against each of the 5 papers. This brings me to my conclusion about the current literature.
First, while all the studies have shortcomings, they collectively provide some insight into the relationship between replications and citations. None are perfect, but I don’t think their flaws are so great as to render their analyses useless. As an aside, because of their flaws, I think there is room for more studies like Hardwicke et al. (2021) that take a case study approach.
Second, while the evidence to date appears to indicate that neither psychology or economics is self-correcting when it comes to failed replications, there is room for more work to be done. This is, after all, an important question.
Comments welcome!
REFERENCES
Ankel-Peters, J., Fiala, N., & Neubauer, F. (2023). Is economics self-correcting? Replications in the American Economic Review. Ruhr Economic Papers, #1005. https://www.rwi-essen.de/fileadmin/user_upload/RWI/Publikationen/Ruhr_Economic_Papers/REP_23_1005.pd
Camerer, C. F., Dreber, A., Forsell, E., Ho, T. H., Huber, J., Johannesson, M., … & Wu, H. (2016). Evaluating replicability of laboratory experiments in economics. Science, 351(6280), 1433-1436.
Camerer, C. F., Dreber, A., Holzmeister, F., Ho, T. H., Huber, J., Johannesson, M., … & Wu, H. (2018). Evaluating the replicability of social science experiments in Nature and Science between 2010 and 2015. Nature Human Behaviour, 2(9), 637-644.
Coupé, T. & Reed, W.R. (2023). Do Replications Play a Self-Correcting Role in Economics? Mimeo, University of Canterbury. https://ideas.repec.org/p/cbt/econwp/22-16.html
Etz, A., & Vandekerckhove, J. (2016). A Bayesian perspective on the reproducibility project: Psychology. PloS One, 11(2), e0149794.
Hardwicke, T. E., Szűcs, D., Thibault, R. T., Crüwell, S., van den Akker, O. R., Nuijten, M. B., & Ioannidis, J. P. (2021). Citation patterns following a strongly contradictory replication result: Four case studies from psychology. Advances in Methods and Practices in Psychological Science, 4(3), 1-14.
Open Science Collaboration (2015). Psychology. Estimating the reproducibility of psychological science. Science, 349(6251), aac4716.
Schafmeister, F. (2021). The effect of replications on citation patterns: Evidence from a large-scale reproducibility project. Psychological Science, 32(10), 1537-1548.
Serra-Garcia, M., & Gneezy, U. (2021). Nonreplicable publications are cited more than replicable ones. Science Advances, 7(21), eabd1705.
von Hippel, P. T. (2022). Is psychological science self-correcting? Citations before and after successful and failed replications. Perspectives on Psychological Science, 17(6), 1556-1565.

You must be logged in to post a comment.