[The following is an adaption of (and in large parts identical to) a recent blog post by Anne Scheel that appeared on The 100% CI .]
Many, probably most empirical scientists use frequentist statistics to decide if a hypothesis should be rejected or accepted, in particular null hypothesis significance testing (NHST).
NHST works when we have access to all statistical tests that are being conducted. That way, we should at least in theory be able to see the 19 null results accompanying every statistical fluke (assuming an alpha level of 5%) and decide that effect X probably does not exist. But publication bias throws this off-kilter: When only or mainly significant results end up being published, whereas null results get p-hacked, file-drawered, or rejected, it becomes very difficult to tell false positive from true positive findings.
The number of true findings in the published literature depends on something significance tests can’t tell us: The base rate of true hypotheses we’re testing. If only a very small fraction of our hypotheses are true, we could always end up with more false positives than true positives (this is one of the main points of Ioannidis’ seminal 2005 paper).
When Felix Schönbrodt and Michael Zehetleitner released this great Shiny app a while ago, I remember having some vivid discussions with Felix about what the rate of true hypotheses in psychology may be. In his very nice accompanying blog post, Felix included a flowchart assuming that 30% of all tested hypotheses are true. At the time I found this grossly pessimistic: Surely our ability to develop hypotheses can’t be worse than a coin flip? We spent years studying our subject! We have theories! We are really smart! I honestly believed that the rate of true hypotheses we study should be at least 60%.
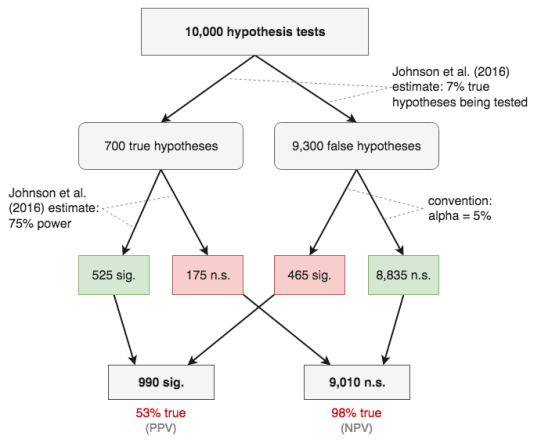
A few months ago, this interesting paper by Johnson, Payne, Want, Asher, & Mandal came out. They re-analysed 73 effects from the Reproducibility Project: Psychology and tried to model publication bias. I have to admit that I’m not maths-savvy enough to understand their model and judge their method, but they estimate that over 700 hypothesis tests were run to produce these 73 significant results. They assume that the statistical power for tests of true hypotheses was 75%, and that 7% of the tested hypotheses were true. Seven percent.
Er, ok, so not 60% then. To be fair to my naive 2015 self: this number refers to all hypothesis tests that were conducted, including p-hacking. That includes the one ANOVA main effect, the other main effect, the interaction effect, the same three tests without outliers, the same six tests with age as covariate, … and so on.

Let’s see what these numbers mean for the rates of true and false findings. For this we will need the positive predictive value (PPV) and the negative predictive value (NPV). I tend to forget what exactly they and their two siblings, FDR and FOR, stand for and how they are calculated, so added the table above as a cheat sheet.
Ok, now we got that out of the way, let’s stick the numbers estimated by Johnson et al. into a flowchart. You see that the positive predictive value is shockingly low: Of all significant results, only 53% are true. Wow. I must admit that even after reading Ioannidis (2005) several times, this hadn’t quite sunk in. If the 7% estimate is anywhere near the true rate, that basically means that we can flip a coin any time we see a significant result to estimate if it reflects a true effect.
But I want to draw your attention to the negative predictive value. The chance that a non-significant finding is true is 98%! Isn’t that amazing and heartening? In this scenario, null results are vastly more informative than significant results.
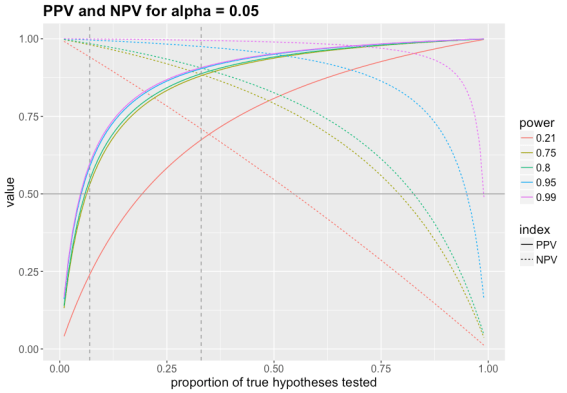
I know what you’re thinking: 7% is ridiculously low. Who knows what those statisticians put into their Club Mate when they calculated this? For those of you who are more like 2015 me and think psychologists are really smart, I plotted the PPV and NPV for different levels of power across the whole range of the true hypothesis rate, so you can pick your favourite one. I chose five levels of power: 21% (estimate for neuroscience by Button et al., 2013), 75% (Johnson et al. estimate), 80% and 95% (common conventions), and 99% (upper bound of what we can reach).
The not very pretty but adaptive (you can chose different values for alpha and power) code is available here.
The plot shows two vertical dashed lines: The left one marks 7% true hypotheses, as estimated by Johnson et al. The right one marks the intersection of PPV and NPV for 75% power: This is the point at which significant results become more informative than negative results. That happens when more than 33% of the studied hypotheses are true. So if Johnson et al. are right, we would need to up our game from 7% of true hypotheses to a whopping 33% to get to a point where significant results are as informative as null results!
There are a few things to keep in mind: First, 7% true hypotheses and 75% power are simply an estimate, based on data from one replication project. I can certainly imagine that this isn’t far from the truth in psychology, but even if the estimate is accurate, it will vary at least slightly across different fields and probably across time.
Second, we have to be clear about what “hypothesis” means in this context: It refers to any statistical test that is conducted. A researcher could have one “hypothesis” in mind, yet perform twenty different hypothesis tests on their data to test this hypothesis, all of which would count towards the denominator when calculating the rate of true hypotheses. I personally believe that the estimate by Johnson et al. is so low because psychologists tend to heavily exploit so-called “researcher degrees of freedom” and test many more hypotheses than they themselves are aware of. Third, statistical power will vary from study to study and the plot above shows that this affects our conclusions. It is also important to bear in mind that power refers to a specific effect size: A specific study has different levels of power for large, medium, and small effects.
We can be fairly certain that most of our hypotheses are false (otherwise we would waste a lot of money by researching trivial questions). The exact percentage of true hypotheses remains unknown, but if it there is something to the estimate of Johnson et al., the fact that an effect is significant doesn’t tell us much about whether or not it is real. Non-significant findings, on the other hand, likely are correct most of the time in this scenario – maybe even 98% of the time! Perhaps we should start to take them more seriously.
Anne Scheel is a PhD student in psychology at Ludwig-Maximilians-Universität, Munich (LMU). She is co-moderator of the Twitter site and co-blogger at The 100% CI. She can be contacted at anne.scheel@psy.lmu.de.
References
Button, K. S., Ioannidis, J. P. A., Mokrysz, C., Nosek, B. A., Flint, J., Robinson, E. S. J., & Munafò, M. R. (2013). Power failure: Why small sample size undermines the reliability of neuroscience. Nature Reviews Neuroscience, 14, 365–376.
Ioannidis, J. P. A. (2005). Why most published research findings are false. PLOS Medicine, 2(8), e124. doi: 10.1371/journal.pmed.0020124
Johnson, V. E., Payne, R. D., Wang, T., Asher, A., & Mandal, S. (2017). On the reproducibility of psychological science. Journal of the American Statistical Association, 112(517), 1-10. doi: 10.1080/01621459.2016.1240079
Open Science Collaboration (2015). Estimating the reproducibility of psychological science. Science, 349(6251), aac4716.
J-PAL has been awarded a three-year grant to promote Research Transparency and Reproducibility. One primary component of this grant is to facilitate the reproducibility of 36 studies through pre-publication reanalyses, a new attempt to conduct code replications of research before it gets published.
The Fall 2017 round of applications for J-PAL’s Research Transparency Graduate Student Fellows will close at 11:59 pm EST on Friday, June 30, 2017. This is an exciting opportunity for graduate students who are excited about research transparency and development economics and are seeking additional funding.
The fellowship program offers financial support (tuition assistance of up to $12,000 and a stipend of $13,000) for one semester (approximately 4.5 months) for current PhD students. While preference will be given to students from economics programs, graduate students from other disciplines with strong quantitative and programming skills (STATA, R etc.) are very welcome to apply.
During the fellowship, students will work with J-PAL’s affiliated professors from dozens of universities around the world, re-analyzing RCTs from scratch (starting with the creation of the data set from “raw survey” data, up to production of the final econometric analysis included in the working papers).
You can find this fellowship announcement on J-PAL’s website. If you have questions, please contact James Turitto at jturitto@povertyactionlab.org.
Finance academics have started to take replication studies seriously. As hundreds of factors have been documented in recent decades, the concern over p-hacking has become especially acute. In a pioneering meta-study, Harvey, Liu, and Zhu (2016) introduce a multiple testing framework into empirical asset pricing. The threshold t-cutoff increases over time as more factors have been data-mined. A new factor today should have a t-value exceeding 3.
Reevaluating 296 significant factors in published studies, Harvey et al. report that 80-158 (27%-53%) are false discoveries. Two publication biases are likely responsible for the high percentage of false positives. First, it is difficult to publish a negative result in top academic journals. Second, more subtly, it is difficult to publish replication studies in finance, while in many other disciplines replications routinely appear in top journals. As a result, finance and accounting academics tend to focus on publishing new factors rather than rigorously verifying the validity of published factors.
Harvey (2017) elaborates the complex agency problem behind the publication biases. Journal editors compete for citation-based impact factors, and prefer to publish papers with the most significant results. In response to this incentive, authors often file away papers with results that are weak or negative, instead of submitting them for publication. More disconcertingly, authors often engage in, consciously or subconsciously, p-hacking, i.e., selecting sample criteria and test procedures until insignificant results become significant. The outcome is an embarrassingly large number of false positives that cannot be replicated in the future.
We conduct a massive replication of the published factors by compiling a largest-to-date data library with 447 variables. The list includes 57, 68, 38, 79, 103, and 102 variables from the momentum, value-versus-growth, investment, profitability, intangibles, and trading frictions categories, respectively. We use a consistent set of replication procedures throughout. To control for microcaps (stocks that are smaller than the 20th percentile of market equity for New York Stock Exchange, or NYSE, stocks), we form testing deciles with NYSE breakpoints and value-weighted returns. We treat a variable as a replication success if its average return spread is significant at the 5% level.
Our replication indicates rampant p-hacking in the published literature. Out of 447 factors, 286 (64%) are insignificant at the 5% level. Imposing the t– cutoff of 3 per Harvey, Liu, and Zhu (2016) raises the number of insignificance to 380 (85%).
The biggest casualty is the liquidity literature. In the trading frictions category, 95 out of 102 variables (93%) are insignificant. Prominent variables that do not survive our replication include Jegadeesh’s (1990) short-term reversal; Datar-Naik-Radcliffe’s (1998) share turnover; Chordia-Subrahmanyam-Anshuman’s (2001) coefficient of variation for dollar trading volume; Amihud’s (2002) absolute return-to-volume; Acharya-Pedersen’s (2005) liquidity betas; Ang-Hodrick-Xing-Zhang’s (2006) idiosyncratic volatility, total volatility, and systematic volatility; Liu’s (2006) number of zero daily trading volume; and Corwin-Schultz’s (2012) high-low bid-ask spread. Several recent friction variables that have received much attention are also insignificant, including Bali-Cakici-Whitelaw’s (2011) maximum daily return; Adrian-Etula-Muir’s (2014) intermediary leverage beta; and Kelly-Jiang’s (2014) tail risk.
The much researched distress anomaly is virtually nonexistent. Campbell-Hilscher-Szilagyi’s (2008) failure probability, the O-score and Z-score in Dichev (1998), and Avramov-Chordia-Jostova-Philipov’s (2009) credit rating all produce insignificant average return spreads.
Other influential but insignificant variables include Bhandari’s (1988) debt-to-market; Lakonishok-Shleifer-Vishny’s (1994) five-year sales growth; several of Abarbanell-Bushee’s (1998) fundamental signals; Diether-Malloy-Scherbina’s (2002) dispersion in analysts’ forecast; Gompers-Ishii-Metrick’s (2003) corporate governance index; Francis-LaFond-Olsson-Schipper’s (2004) earnings attributes, including persistence, smoothness, value relevance, and conservatism; Francis et al.’s (2005) accruals quality; Richardson-Sloan-Soliman-Tuna’s (2005) total accruals; and Fama-French’s (2015) operating profitability, which is a key variable in their 5-factor model.
Even for significant anomalies, their magnitudes are often much lower than originally reported. Famous examples include Jegadeesh-Titman’s (1993) price momentum; Lakonishok-Shleifer-Vishny’s (1994) cash flow-to-price; Sloan’s (1996) operating accruals; Chan-Jegadeesh-Lakonishok’s (1996) standardized unexpected earnings, abnormal returns around earnings announcements, and revisions in analysts’ earnings forecasts; Cohen-Frazzini’s (2008) customer momentum; and Cooper-Gulen-Schill’s (2008) asset growth.
Why does our replication differ so much from the original studies? The key word is microcaps. Microcaps represent only 3% of the total market capitalization of the NYSE-Amex-NASDAQ universe, but account for 60% of the number of stocks. Microcaps not only have the highest equal-weighted returns, but also the largest cross-sectional standard deviations in returns and anomaly variables. Many studies overweight microcaps with equal-weighted returns, and often together with NYSE-Amex-NASDAQ breakpoints, in portfolio sorts.
Hundreds of studies use cross-sectional regressions of returns on anomaly variables, assigning even higher weights to microcaps. The reason is that regressions impose a linear functional form, making them more susceptible to outliers, which most likely are microcaps. Alas, due to high costs in trading these stocks, anomalies in microcaps are more apparent than real. More important, with only 3% of the total market equity, the economic importance of microcaps is small, if not trivial.
Our low replication rate of only 36% is not due to our extended sample relative to the original studies. Repeating our replication in the original samples, we find that 293 (66%) factors are insignificant at the 5% level, including 24, 44, 13, 38, 81, and 93 across the momentum, value-versus-growth, investment, profitability, intangibles, and trading frictions categories, respectively. Imposing the t-cutoff of three raises the number of insignificance to 387 (86.6%). The total number of insignificance at the 5% level, 293, is even higher than 286 in the extended sample. In all, the results from the original samples are close to those from the full sample.
We also use the Hou, Xue, and Zhang (2015) q-factor model to explain the 161 significant anomalies in the full sample. Out of the 161, the q-factor model leaves 115 alphas insignificant (150 with t<3). In all, capital markets are more efficient than previously recognized.
Kewei Hou is Fisher College of Business Distinguished Professor of Finance at The Ohio State University. Chen Xue is Assistant Professor of Finance at University of Cincinnati. Lu Zhang is the John W. Galbreath Chair, Professor of Finance, at The Ohio State University. Correspondence about this blog should be addressed to Lu Zhang at zhanglu@fisher.osu.edu.
REFERENCES
Abarbanell, J. S., & Bushee, B. J. (1998). Abnormal returns to a fundamental analysis strategy. The Accounting Review, 73, 19-45.
Acharya, V. V., & Pedersen, L. H. (2005). Asset pricing with liquidity risk. Journal of Financial Economics, 77, 375-410.
Adrian, T., Etula, E., & Muir, T. (2014). Financial intermediaries and the cross-section of asset returns. Journal of Finance, 69, 2557-2596.
Amihud, Y. (2002). Illiquidity and stock returns: Cross-section and time series evidence. Journal of Financial Markets, 5, 31-56.
Ang, A., Hodrick, R. J., Xing, Y., & Zhang, X. (2006). The cross-section of volatility and expected returns. Journal of Finance, 61, 259-299.
Avramov, D., Chordia, T., Jostova, G., & Philipov, A. (2009). Credit ratings and the cross-section of stock returns. Journal of Financial Markets, 12, 469-499.
Bali, T. G., Cakici, N., & Whitelaw, R. F. (2011). Maxing out: Stocks as lotteries and the cross-section of expected returns. Journal of Financial Economics, 99, 427-446.
Bhandari, L. C. (1988). Debt/equity ratio and expected common stock returns: Empirical evidence. Journal of Finance, 43, 507-528.
Campbell, J. Y., Hilscher, J., & Szilagyi, J. (2008). In search of distress risk. Journal of Finance, 63, 2899-2939.
Chan, L. K. C., Jegadeesh, N., & Lakonishok, J. (1996). Momentum strategies, Journal of Finance, 51, 1681-1713.
Chordia, T., Subrahmanyam, A., & Anshuman, V. R. (2001). Trading activity and expected stock returns. Journal of Financial Economics, 59, 3-32.
Cohen, L., & Frazzini, A. (2008). Economic links and predictable returns, Journal of Finance, 63, 1977-2011.
Cooper, M. J., Gulen, H., & Schill, M. J. (2008). Asset growth and the cross-section of stock returns, Journal of Finance, 63, 1609-1652.
Corwin. S. A., & Schultz, P. (2012). A simple way to estimate bid-ask spreads from daily high and low prices. Journal of Finance, 67, 719-759.
Datar, V. T., Naik, N. Y., & Radcliffe, R. (1998). Liquidity and stock returns: An alternative test. Journal of Financial Markets, 1, 203-219.
Dichev, I. (1998). Is the risk of bankruptcy a systematic risk? Journal of Finance, 53, 1141-1148.
Diether, K. B., Malloy, C. J., &Scherbina, A. (2002). Differences of opinion and the cross section of stock returns, Journal of Finance, 57, 2113-2141.
Fama, E. F., & French, K. R. (2015). A five-factor asset pricing model, Journal of Financial Economics, 116, 1-22.
Francis, J., LaFond, R., Olsson, P. M., & Schipper, K. (2004). Cost of equity and earnings attributes, The Accounting Review, 79, 967-1010.
Francis, J., LaFond, R., Olsson, P. M., & Schipper, K. (2005). The market price of accruals quality, Journal of Accounting and Economics, 39, 295-327.
Gompers, P., Ishii, J., & Metrick, A. (2001). Corporate governance and equity prices, Quarterly Journal of Economics, 118, 107-155.
Harvey, C. R. (2017). Presidential address: The scientific outlook in financial economics. Journal of Finance, forthcoming.
Harvey, C. R., Liu, Y., & Zhu, H. (2016). …and the cross-section of expected returns. Review of Financial Studies, 29, 5-68.
Hou, K., Xue, C., & Zhang, L. (2015). Digesting anomalies: An investment approach. Review of Financial Studies, 28, 650-705.
Jegadeesh, N. (1990). Evidence of predictable behavior of security returns. Journal of Finance, 45, 881-898.
Jegadeesh, N. & Titman, S. (1993). Returns to buying winners and selling losers: Implications for stock market efficiency. Journal of Finance, 48, 65-91.
Kelly, B., & Jiang, H. (2014). Tail risk and asset prices. Review of Financial Studies, 27, 2841-2871.
Lakonishok, J., Shleifer, A., & Vishny, R. W. (1994). Contrarian investment, extrapolation, and risk, Journal of Finance, 49, 1541-1578.
Liu, W. (2006). A liquidity-augmented capital asset pricing model. Journal of Financial Economics, 82, 631-671.
Richardson, S. A., Sloan, R. G., Soliman, M. T., & Tuna, I. (2005). Accrual reliability, earnings persistence and stock prices, Journal of Accounting and Economics, 39, 437-485.
Sloan, R. G. (1996). Do stock prices fully reflect information in accruals and cash flows about future earnings? The Accounting Review, 71, 289-315.
In a great blog (“Why we should love null results”) posted at The 100% CI, Anne Scheel gives some reasons why we should love statistically insignificant findings. Her reasons include:
— “We should love null results to counter our tendency to underestimate their quality.”
— “We should love null results because they are our stepping stones to positive results, and although we might get lucky sometimes, we can’t just decide to skip that queue.”
— “We should love null results because they are more likely to be true than significant results.”
Null results are more likely to be true than significant results? How can that be?! Think PPV. Or better yet, read the blog (click here).
In a recent post (“Open data for the busy researcher”), Richard D. Morey suggests an easy way to share data. The hardest part is getting started. The following steps make it easy to “ease in” to the process of making your data available.
“Create an OSF page for the project. If you’ve never used OSF before, you may have to create an account, but this is easy. If you need help, there are guides.”
“Add a README file describing the project (perhaps title and abstract, and, importantly, your contact information). Say that the data/materials for the project will be placed there, and in the meantime, people who want access to the data/materials should contact you. This is a “stub” OSF page, awaiting your later additions.”
“Add the link to this OSF page in your manuscript (perhaps in the author note). Write something like “Information about obtaining data and materials underlying this paper can be found at X.” where X is your OSF page’s URL.”
“When you have time — hopefully before the paper is formally published — populate the OSF page.”
“To do everything I’ve described above takes only a few minutes, at most, except for the last step. Consider the worst case scenario: you forget to upload the materials/data. Then a curious researcher simply emails you as would be typical, and asks you for it. The link to the OSF page points to your contact information, so nothing is lost.”
[From the article “Science Needs a Solution for the Temptation of Positive Results” by Aaron E. Carroll at The New York Times/The Upshot website]
“Science has a reproducibility problem. … As long as the academic environment has incentives for scientists to work in silos and hoard their data, transparency will be impossible. As long as the public demands a constant stream of significant results, researchers will consciously or subconsciously push their experiments to achieve those findings, valid or not. As long as the media hypes new findings instead of approaching them with the proper skepticism, placing them in context with what has come before, everyone will be nudged toward results that are not reproducible.”
In our AER Papers and Proceedings paper, “Assessing the Rate of Replications in Economics” we try to answer two questions. First, how often do economists attempt to replicate results? Second, how aware are we collectively of replication attempts that do happen?
Going into this project, the two of us were concerned about the state of replication in the profession, but neither of us really knew for sure just how bad (or good) it might be. To get a better handle on the problem, we set out to quantify just how often results produced in subsequent work spoke to the veracity of the core insights in empirical papers (even if this was not the main goal of the follow up work).
We couldn’t answer this for all work ever done, so we needed to limit the exercise to a meaningful subsample. To do this we chose a base set of papers from the AER’s 100th volume, published in 2010. This volume sample therefore represented important, general-interest ideas in economics, and gave all the papers at least 5 years since publication to accrue replication attempts.
We wanted to be fairly comprehensive on the fields we included, but we also wanted to focus on “replication” in a very broad sense: had the core hypothesis of the previous paper been exposed to a retest and incorporated into the published literature? But this broad definition led to a problem on the coding, as we wanted the reader of each volume paper to be an expert in the field providing his or her opinion on whether something was a replication. To solve this, we put together a group of coauthors who possessed expertise across of an array of fields (adding James Berry, Rania Gihleb, and Douglas Hanley to the project).
Assigning the volume papers by specialty, we read through and coded just over 1,500 papers citing one of the 70 empirical papers in our volume sample. For each paper we coded our subjective opinions on whether each was a replication and/or an extension for one of the original paper’s main hypotheses. Alongside this, we also coded more-objective definitions on the relationship of the data in each citing paper to the original, allowing us to compare our top-level replication coding to the definitions given by Michael Clemens.
The end results from our study indicate that only a quarter of the papers in our volume sample were replicated at least once, while 60 percent had either been replicated or extended at least once. While the replication figure is still lower than we would want, it was higher than we expected. Moreover, the papers that were replicated were the most important papers in our sample: Every single volume paper in our sample with 100 published citations had been replicated at least once. Given 50 published citations, the paper was more likely to have been replicated than not. While the quantitative rates differ slightly, this qualitative result is replicated by the findings in the session papers by Daniel Hamermesh and Sandip Sukhtankar (examining very well-cited papers in labor economics, and top-5/field publications in development economics, respectively.)
While the replication rates that we found were certainly higher than we initially expected, one thing that we discovered from the coding exercise was how hard it was to find replications. Our coding exercise was an exhaustive search within all published economics papers citing one of our volume papers. In total we turned up 52 papers that we coded as a replication, where the vast majority of these were positive replications. But of these 52, only 18 actually explicitly presented themselves as replications. Simply searching for a paper with a keyword such as “replication” isn’t enough, as many of the replications we found were buried as sub-results within larger papers, for which the replication was not the main contribution.
This hampers awareness of replications. Though one might expect that knowledge of replications is better distributed among the experts within each literature, in a survey we conducted of the volume-paper authors and a subsample of the citing authors, the main finding was substantial uncertainty on the degree to which papers and ideas had been replicated.
Certainly the profession could do a far better job in organizing replications through a market design approach. In a companion paper to this one that we wrote with Muriel Niederle, we set out some modest proposals for better citation and republication incentives for doing so. But much, much more is possible.
Lucas Coffman is a Visiting Associate Professor of Economics at Harvard University. Alistair Wilson is an Assistant Professor of Economics at the University of Pittsburgh. Comments/feedback about this blog can be directed to Alistair at alistair@pitt.edu.
REFERENCES:
– Berry, James , Lucas Coffman, Rania Gihleb, Douglas Hanley and Alistair J. Wilson. 2017. “Assessing the Rate of Replication in Economics” Am. Econ. Rev P&P, 107 (5): p.27-31
– Coffman, Lucas, Muriel Niederle and Alistair J. Wilson. 2017. “A Proposal to Incentivize, Promote, and Organize Replications” Am. Econ. Rev P&P, 107 (5): p.41-5
– Clemens, Michael. 2017. “The Meaning of Failed Replications: A Review and Proposal.” J. Econ. Surv. 31 (1): p.326–42
– Hamermesh, Daniel S. 2017. “What is Replication? The Possibly Exemplary Example of Labor Economics.” Am. Econ. Rev P&P, 107 (5): p.37-40.
–Sukhtankar, Sandip. 2017. “Replications in Development Economics” Am. Econ. Rev P&P, 107 (5): p.32-6
The Replication Network is proud to announce that we are now listed on the American Economic Association’s website, Resources for Economists on the Internet (RFE), edited by Bill Goffe at Penn State University. We are listed under “Data / Journal Data and Program Archives / Replication Studies”. You can find us by clicking this. Of course, that would be rather pointless since you are already here!
[From Rolf Zwaan’s blog “Zeitgeist”.]
“A form of replication that has received not much attention yet is what I will call concurrent replication. The basic idea is this. A research group formulates a hypothesis that they want to test. At the same time, they desire to have some reassurance about the reliability of the finding they expect to obtain. They decide to team up with another research group. They provide this group with a protocol for the experiment, the program and stimuli to run the experiment, and the code for the statistical analysis of the data. The experiment is preregistered. Both groups then each run the experiment and analyze the data independently. The results of both studies are included in the article, along with a meta-analysis of the results.”
[From the article “5 diseases ailing research — and how to cure them” at Elsevier Connect, the daily news site for Elsevier Publishing.]
This article summarizes the “diseases” ailing scientific research as identified in the article “On doing better science: From thrill of discovery to policy implications” by John Antonakis, recently published in The Leadership Quarterly.
Various Elsevier associates then discuss how they see these problems being addressed. Given the huge role that Elsevier plays in academic publishing, their view of the problems of scientific research/publishing, and their ideas regarding potential solutions, should be of interest. To read more, click here.


You must be logged in to post a comment.