Observed power (or post-hoc power) is the statistical power of the test you have performed, based on the effect size estimate from your data. Statistical power is the probability of finding a statistical difference from 0 in your test (aka a ‘significant effect’), if there is a true difference to be found. Observed power differs from the true power of your test, because the true power depends on the true effect size you are examining. However, the true effect size is typically unknown, and therefore it is tempting to treat post-hoc power as if it is similar to the true power of your study. In this blog, I will explain why you should never calculate the observed power (except for blogs about why you should not use observed power). Observed power is a useless statistical concept. –Daniël Lakens from his blog “Observed power, and what to do if your editor asks for post-hoc power analyses” at The 20% Statistician
Is observed power a useless statistical concept? Consider two researchers, each interested in estimating the effect of a treatment T on an outcome variable Y. Each researcher assembles an independent sample of 100 observations. Half the observations are randomly assigned the treatment, with the remaining half constituting the control group. The researchers estimate the equation Y = a + bT + error.
The first researcher obtains the results:

The estimated treatment effect is relatively small in size, statistically insignificant, and has a p-value of 0.72. A colleague suggests that perhaps the researcher’s sample size is too small and, sure enough, the researcher calculates a post-hoc power value of 5.3%.
The second researcher estimates the treatment effect for his sample, and obtains the following results:
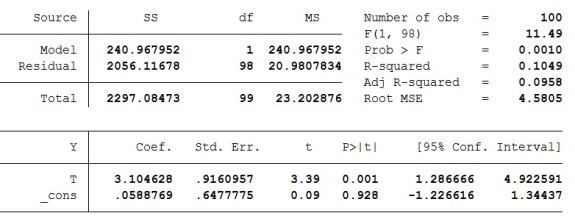
The estimated treatment effect is relatively large and statistically significant with a p-value below 1%. Further, despite having the same number of observations as the first researcher, there is apparently no problem with power here, because the post-hoc power associated with these results is 91.8%.
Would it surprise you to know that both samples were drawn from the same data generating process (DGP): Y = 1.984×T + e, where e ~ N(0, 5)? The associated study has a true power of 50%.
The fact that post-hoc power can differ so substantially from true power is a point that has been previously made by a number of researchers (e.g., Hoenig and Heisey, 2001), and highlighted in Lakens’ excellent blog above.
The figure below presents a histogram of 10,000 simulations of the DGP, Y = 1.984×T + e, where e ~ N(0, 5), each with 100 observations, and each calculating post-hoc power following estimation of the equation. The post-hoc power values are distributed uniformly between 0 and 100%.

So are post-hoc power analyses good for nothing? That would be the case if a finding that an estimated effect was “underpowered” told us nothing more about its true power than a finding that it had high, post-hoc power. But that is not the case. In general, the expected value of a study’s true power will be lower for studies that are calculated to be “underpowered.”
Define “underpowered” as having a post-hoc power less than 80%, with studies having post-hoc power greater than or equal to 80% deemed to be “sufficiently powered.” The table below reports the results of a simulation exercise where “Beta” values are substituted into the DGP, Y = Beta × T + e, e ~ N(0, 5), such that true power values range from 10% to 90%. A 1000 simulations for each Beta value were run and the percent of times recorded that the estimated effects were calculated to be “underpowered.”

If studies were uniformly distributed across power categories, the expected power for an estimated treatment effect that was calculated to be “underpowered” would be approximately 43%. The expected power for an estimated treatment effect that was calculated to be “sufficiently powered” would be approximately 70%. More generally, E(true power| “underpowered”) ≥ E(true power|“sufficiently powered”).
At the extreme other end, if studies were massed at a given power level, say 30%, then E(true power|“underpowered”) = E(true power|“sufficiently powered”) = 30%, and there would be nothing learned from calculating post-hoc power.
Assuming that studies do not all have the same power, it is safe to conclude that E(true power| “underpowered”) > E(true power|“sufficiently powered”): Post-hoc “underpowered” studies will generally have lower true power than post-hoc “sufficiently powered” studies. But that’s it. Without knowing the distribution of studies across power values, we cannot calculate the expected value of true power from post-hoc power.
In conclusion, it’s probably too harsh to say that post-hoc power analyses are good for nothing. They’re just not of much practical value, since they cannot be used to calculate the expected value of the true power of a study.
Bob Reed is Professor of Economics at the University of Canterbury in New Zealand and co-founder of The Replication Network. He can be contacted at bob.reed@canterbury.ac.nz.
REFERENCES
Hoenig, John M., & Heisey, Dennis M. (2001). The abuse of power: The pervasive fallacy of power calculations for data analysis. The American Statistician, Vol. 55, No. 1, pp. 19-24.
[From the abstract of a recent NBER working paper by Kewei Hou, Chen Xue, and Lu Zhang entitled “Replicating Anomalies”]
“The anomalies literature is infested with widespread p-hacking. We replicate the entire anomalies literature in finance and accounting by compiling a largest-to-date data library that contains 447 anomaly variables. With microcaps alleviated via New York Stock Exchange breakpoints and value-weighted returns, 286 anomalies (64%) including 95 out of 102 liquidity variables (93%) are insignificant at the conventional 5% level. Imposing the cutoff t-value of three raises the number of insignificance to 380 (85%). Even for the 161 significant anomalies, their magnitudes are often much lower than originally reported. Out of the 161, the q-factor model leaves 115 alphas insignificant (150 with t < 3). In all, capital markets are more efficient than previously recognized.”
A very nice and balanced discussion of the issues involved in criticizing other researchers’ work on social media can be found in the article “How Should We Talk About Amy Cuddy, Death Threats, and the Replication Crisis?” by Jesse Singal at nymag.com.
A tweet that appears in the article succinctly summarizes one of its messages: “1. Bullying/Threats: BAD; 2. Scientific criticism: healthy”. Tone matters. A lot. However, the article goes on to say more:
“The more open and transparent science is, the less time researchers and observers will spend on hopelessly subjective questions of tone and intent. To be clear, there will never be a time when the questions raised by the replication crisis can be answered or evaluated in a purely objective manner, of course. Even when everyone has access to the data underpinning a given controversy, reasonable people, again, can and do disagree on which claims are warranted on the basis of which evidence.”
“But the faster we can get to an age in which data sharing and transparency in general are established norms in psychology, the easier it will be to avoid getting mired in unanswerable debates about really subjective subjects like tone.”
When we perform a study, we would like to conclude there is an effect, when there is an effect. But it is just as important to be able to conclude there is no effect, when there is no effect. So how can we conclude there is no effect? Traditional null-significance hypothesis tests won’t be of any help here. If you observe a p > 0.05, concluding that there is no effect is a common erroneous interpretation of p-values.
One solution is equivalence testing. In an equivalence test, you statistically test whether the observed effect is smaller than anything you care about. One commonly used approach is the two-one-sided test (TOST) procedure (Schuirmann, 1987). Instead of rejecting the null-hypothesis that the true effect size is zero, as we traditionally do in a statistical test, the null-hypothesis in the TOST procedure is that there is an effect.
For example, when examining a correlation, we might want to reject an effect as large, or larger, than a medium effect in either direction (r = 0.3 or r = -0.3). In the two-sided test approach, you would test whether the observed correlation is significantly smaller than r = 0.3, and test whether the observed correlation is significantly larger than r = -0.3. If both these tests are statistically significant (or, because these are one-sided tests, when the 90% confidence interval around our correlation does not include the equivalence bounds of -0.3 and 0.3) we can conclude the effect is ‘statistically equivalent’. Even if the effect is not exactly 0, we can reject the hypothesis that the true effect is large enough to care about.
Setting the equivalence bounds requires that you take a moment to think about which effect size you expect, and which effect sizes you would still consider support for your theory, or which effects are large enough to matter in practice. Specifying the effect you expect, or the smallest effect size you are still interested in, is good scientific practice, as it makes your hypothesis falsifiable. If you don’t specify a smallest effect size that is still interesting, it is impossible to falsify your hypothesis (if only because there are not enough people in the world to examine effects of r = 0.0000001).
Furthermore, when you specify which effects are too small to matter, it is possible to find an effect is both significantly different from zero, and significantly smaller than anything you care about. In other words, the finding lacks ‘practical significance’, solving another common problem with overreliance on traditional significance tests. You don’t have to determine the equivalence bounds for every other researcher – you can specify which effect sizes you would still find worthwhile to examine, perhaps based on the resources (e.g., the number of participants) you have available.
You can use equivalence tests in addition to null-hypothesis significance tests. This means there are now four possible outcomes of your data analysis, and these four cases are illustrated in the figure below (adapted from Lakens, 2017). A mean difference of Cohen’s d = 0.5 (either positive or negative) is specified as a smallest effect size of interest in an independent t-test (see the vertical dashed lines at -0.5 and 0.5). Data is collected, and one of four possible outcomes is observed (squares are the observed effect size, thick lines the 90% CI, and thin lines the 95% CI).
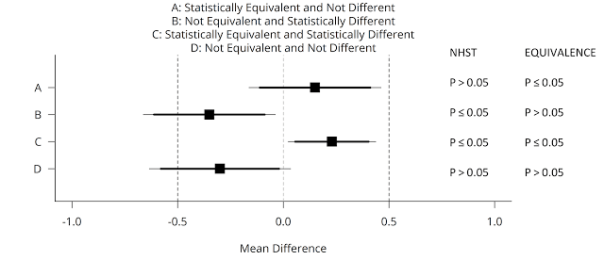
We can conclude statistical equivalence if we find the pattern indicated by A: The p-value from the traditional NHST is not significant (p > 0.05), and the p-value for the equivalence test is significant (p ≤ 0.05). However, if the p-value for the equivalence test is also > 0.05, the outcome matches pattern D, and we can not reject an effect of 0, nor an effect that is large enough to care about. We thus remain undecided. Using equivalence tests, we can also observe pattern C: An effect is statistically significant, but also smaller than anything we care about, or equivalent to null (indicating the effect lacks practical significance). We can also conclude the effect is significant, and that the possibility that the effect is large enough to matter can not be rejected, under pattern B, which means we can reject the null, and the effect might be large enough to care about.
Testing for equivalence is just as simple as performing the normal statistical tests you already use today. You don’t have to learn any new statistical theory. Given how easy it is to use equivalence tests, and how much they improve your statistical inferences, it is surprising how little they are used, but I’m confident that will change in the future.
To make equivalence tests for t-tests (one-sample, independent, and dependent), correlations, and meta-analyses more accessible, I’ve created an easy to use spreadsheet, and an R package (‘TOSTER’, available from CRAN), and incorporated equivalence test as a module in the free software jamovi. Using these spreadsheets, you can perform equivalence tests either by setting the equivalence bound to an effect size (e.g., d = 0.5, or r = 0.3) or to raw bounds (e.g., a mean difference of 200 seconds). Extending your statistical toolkit with equivalence tests is an easy way to improve your statistical and theoretical inferences.
Daniël Lakens is an Assistant Professor in Applied Cognitive Psychology at the Eindhoven University of Technology in the Netherlands. He blogs at The 20% Statistician and can be contacted at D.Lakens@tue.nl.
REFERENCES
Lakens, D. (2017). Equivalence tests: A practical primer for t-tests, correlations, and meta-analyses. Social Psychological and Personality Science. DOI: 10.1177/1948550617697177 https://osf.io/preprints/psyarxiv/97gpc/
Schuirmann, Donald J. (1987). A comparison of the two one-sided tests procedure and the power approach for assessing the equivalence of average bioavailability. Journal of Pharmacokinetics and Pharmacodynamics 15(6): 657-680.
[From the abstract of a new working paper by DANIEL SIMONS, YUICHI SHODA, and D. STEPHEN LINDSAY entitled “Constraints on Generality (COG): A Proposed Addition to All Empirical Papers”]
“A cumulative science depends on accurately characterizing the generality of findings, but current publishing standards do not require authors to constrain their inferences, leaving readers to assume the broadest possible generalizations. We propose that the discussion section of all primary research articles specify Constraints on Generality (a “COG” statement), identifying and justifying target populations for the reported findings. Explicitly defining the target populations will help other researchers to sample from the same populations when conducting a direct replication, and it will encourage follow-up studies that test the boundary conditions of the original finding. Universal adoption of COG statements would change publishing incentives to favor a more cumulative science.”
[From the article, “The ASA’s p-value statement, one year on”, which appeared in the online journal Significance, a publication of the American Statistical Association]
“A little over a year ago now, in March 2016, the American Statistical Association (ASA) took the unprecedented step of issuing a public warning about a statistical method. …From clinical trials to epidemiology, educational research to economics, p-values have long been used to back claims for the discovery of real effects amid noisy data. By serving as the acid test of “statistical significance”, they have underpinned decisions made by everyone from family doctors to governments. Yet according to the ASA’s statement, p-values and significance testing are routinely misunderstood and misused, resulting in “insights” which are more likely to be meaningless flukes. … Yet a year on, it is not clear that the ASA’s statement has had any substantive effect at all.”
The journal Economics: The Open Access, Open Assessment E-Journal is publishing a special issue on “The Practice of Replication.” This is how the journal describes it:
“The last several years have seen increased interest in replications in economics. This was highlighted by the most recent meetings of the American Economic Association, which included three sessions on replications (see here, here, and here). Interestingly, there is still no generally acceptable procedure for how to do a replication. This is related to the fact that there is no standard for determining whether a replication study “confirms” or “disconfirms” an original study. This special issue is designed to highlight alternative approaches to doing replications, while also identifying core principles to follow when carrying out a replication.”
“Contributors to the special issue will each select an influential economics article that has not previously been replicated, with each contributor selecting a unique article. Each paper will discuss how they would go about “replicating” their chosen article, and what criteria they would use to determine if the replication study “confirmed” or “disconfirmed” the original study.”
“Note that papers submitted to this special issue will not actually do a replication. They will select a study that they think would be a good candidate for replication; and then they would discuss, in some detail, how they would carry out the replication. In other words, they would lay out a replication plan.”
“Submitted papers will consist of four parts: (i) a general discussion of principles about how one should do a replication, (ii) an explanation of why the “candidate” paper was selected for replication, (iii) a replication plan that applies these principles to the “candidate” article, and (iv) a discussion of how to interpret the results of the replication (e.g., how does one know when the replication study “replicates” the original study).”
“The contributions to the special issue are intended to be short papers, approximately Economics Letters-length (though there would not be a length limit placed on the papers).”
“The goal is to get a fairly large number of short papers providing different approaches on how to replicate. These would be published by the journal at the same time, so as to maintain independence across papers and approaches. Once the final set of articles are published, a summary document will be produced, the intent of which is to provide something of a set of guidelines for future replication studies.”
Despite all the attention that economics, and other disciplines, have devoted to research transparency, data sharing, open science, reproducibility, and the like, much remains to be done on best practice guidelines for doing replications. Further, there is much confusion about how one should interpret the results from replications. Perhaps this is not surprising. There is still much controversy about how to interpret tests of hypotheses! At the very least, it is helpful to have a better understanding of the current state of replication practice, and how replicators understand their own research. It is hoped that this special issue will help to progress our understanding on these subjects.
To read more about the special issue, and how to contribute, click here.
[From an interview with Christopher Chartier and Randy McCarthy at Retraction Watch]
“Do researchers need a new “Craigslist?” We were recently alerted to a new online platform called StudySwap by one of its creators … The platform creates an “online marketplace” that previous researchers have called for, connecting scientists with willing partners – such as a team looking for someone to replicate its results, and vice versa.”
[From the article “Stop binning negative results, researchers told” at www.timeshighereducation.com] “A new Europe-wide code of research conduct has ordered academics and journals to treat negative experimental results as being equally worthy of publication as positive ones. … The new European Code of Conduct for Research Integrity frames the bias against negative results as an issue of research conduct, stipulating that ‘authors and publishers [must] consider negative results to be as valid as positive findings for publication and dissemination’.”
Reproducibility is not just an issue in economics. In a new book, “Rigor Mortis: How Sloppy Science Creates Worthless Cures, Crushes Hope, and Wastes Billions”, NPR science reporter Richard Harris describes and elaborates on the problem of irreproducibility for medical science. The website Retraction Watch caught up with Richard Harris to discuss his new book and his thoughts on the larger problem of “sloppy science.” To read the interview, click here.


You must be logged in to post a comment.