This blog is based on the homonymous paper by Norbert Hirschauer, Sven Grüner, Oliver Mußhoff, and Claudia Becker in the Journal of Economics and Statistics. It is motivated by prevalent inferential errors and the intensifying debate on p-values – as expressed, for example in the activities of the American Statistical Association including its p-value symposium in 2017 and the March 19 Special Issue on Statistical inference in the 21st century: A world beyond P < 0.05. A related petition in Nature arguing that it is time to retire statistical significance was supported by more than 800 scientists. While we provide more details and practical advice, our 20 suggestions are essentially in line with this petition.
Even if one is aware of the fundamental pitfalls of null hypothesis statistical testing (NHST), it is difficult to escape the categorical reasoning that is so entrancingly suggested by its dichotomous significance declarations. With a view to the p-value’s deep entrenchment in current research practices and the apparent need for a basic consensus on how to do things in the future, we suggest twenty immediately actionable steps to reduce widespread inferential errors.
Our propositions aim at fostering the logical consistency of inferential arguments, which is the prerequisite for understanding what we can and what we cannot conclude from both original studies and replications. They are meant to serve as a discussion base or even tool kit for editors of economics journals who aim at revising their guidelines to increase the quality of published research.
Suggestion 1: Refrain from using p-values if you have data of the whole population of interest. In this case, no generalization (inference) from the sample to the population is necessary. Do not use p-values either if you have a non-random sample that you chose for convenience reasons instead of using probability methods: p-values conceptually require a random process of data generation.
Suggestion 2: Distinguish the function of the p-value depending on the type of the data generating process. In the random sampling case, you are concerned with generalizing from the sample to the population (external validity). In the random assignment case, you are concerned with the causal treatment effects in an experiment with random assignment (internal validity).
Suggestion 3: When using p-values as an inferential aid in the random sampling case, provide convincing arguments that your sample represents at least approximately a random sample. To avoid misunderstandings, transparently state how and from which population the random sample was drawn and, consequently, to which target population you want to generalize.
Suggestion 4: Do use wordings that ensure that the p-value is understood as a graded measure of the strength of evidence against the null, and that no particular information is associated with a p-value being below or above some arbitrary threshold such as 0.05.
Suggestion 5: Do not insinuate that the p-value denotes an epistemic (posterior) probability of a scientific hypothesis given the evidence in your data. Stating that you found an effect with an “error probability” of p is misleading. It erroneously suggests that the p-value is the probability of the null – and therefore the probability of being “in error” when rejecting it.
Suggestion 6: Do not insinuate that a low p-value indicates a large or even practically relevant effect size. Use wordings such as “large” or “relevant” but refrain from using “significant” when discussing the effect size – at least as long dichotomous interpretations of p-values linger on in the scientific community.
Suggestion 7: Do not suggest that high p-values can be interpreted as an indication of no effect (“evidence of absence”). Do not even suggest that high p-values can be interpreted as “absence of evidence.” Doing so would negate the evident findings from your data.
Suggestion 8: Do not suggest that p-values below 0.05 can be interpreted as evidence in favor of the just-estimated coefficient. Formulations saying that you found a “statistically significant effect of size z” should be avoided because they mix up estimating and testing. The strength of evidence against the null cannot be translated into evidence in favor of the estimate that you happened to find in your sample.
Suggestion 9: Avoid the terms “hypothesis testing” and “confirmatory analysis,” or at least put them into proper perspective and communicate that it is impossible to infer from the p-value whether the null hypothesis or an alternative hypothesis is true. In any ordinary sense of the terms, a p-value cannot “test” or “confirm” a hypothesis, but only describe data frequencies under a certain statistical model including the null.
Suggestion 10: Restrict the use of the word “evidence” to the concrete findings in your data and clearly distinguish this evidence from your inferential conclusions, i.e., the generalizations you make based on your study and all other available evidence.
Suggestion 11: Do explicitly state whether your study is exploratory (i.e. aimed at generating new hypotheses) or whether you aim at producing new evidence for pre-specified (ex ante) hypotheses.
Suggestion 12: In exploratory search for potentially interesting associations, do never use the term “hypotheses testing” because you have no testable ex ante hypotheses.
Suggestion 13: If your study is (what would be traditionally called) “confirmatory” (i.e., aimed at producing evidence regarding pre-specified hypotheses), exactly report in your paper the hypotheses that you drafted as well as the model you specified before seeing the data. In the results section, clearly relate findings to these ex ante hypotheses.
Suggestion 14: When studying pre-specified hypotheses, clearly distinguish two parts of the analysis: (i) the description of the empirical evidence that you found in your study (What is the evidence in the data?) and (ii) the inferential reasoning that you base on this evidence (What should one reasonably believe after seeing the data?). If applicable, a third part should outline the recommendations or decisions that you would make all things considered, including the weights attributed to type I and type II errors (What should one do after seeing the data?).
Suggestion 15: If you fit your model to the data even though you are concerned with pre-specified hypotheses, explicitly demonstrate that your data-contingent model specification does not constitute “hypothesizing after the results are known.” When using p-values as an inferential aid, explicitly consider and comment on multiple comparisons.
Suggestion 16: Explicitly distinguish statistical and scientific inference. Statistical inference is about generalizing from a random sample to its parent population. This is only the first step of scientific inference, which is the totality of reasoned judgments (inductive generalizations) that we make in the light of the total body of evidence. Be clear that a p-value, can do nothing to assess the generalizability of results beyond a random sample’s parent population.
Suggestion 17: Provide information regarding the size of your estimate. In many regression models, a meaningful representation of magnitudes will require going beyond coefficient estimates and displaying marginal effects or other measures of effect size.
Suggestion 18: Do not use asterisks (or the like) to denote different levels of “statistical significance.” Doing so could instigate erroneous categorical reasoning.
Suggestion 19: Provide p-values if you use the graded strength of evidence against the null as an inferential aid (amongst others). However, do not classify results as being “statistically significant” or not. That said, avoid using the terms “statistically significant” and “statistically non-significant” altogether.
Suggestion 20: Provide standard errors for all effect size estimates. Additionally, provide confidence intervals for the focal variables associated with your pre-specified hypotheses.
While following these suggestions would prevent overconfident yes/no conclusions both in original and replication studies, we do not expect that all economists will endorse all of them at once. Some, such as providing effect size measures and displaying standard errors, are likely to cause little controversy. Others, such as renouncing dichotomous significance declarations and giving up the term “statistical significance” altogether, will possibly be questioned.
Opposition against giving up conventional yes/no declarations is likely to be fueled by the fact that no joint understanding and consensus has yet been reached as to which formulations are appropriate to avoid cognitive biases and communicate the correct but per se limited informational content of frequentist concepts such as p-values and confidence intervals. Such joint understandings and consensus regarding best practice are in dire need.
Prof. Norbert Hirschauer, Dr. Sven Grüner, and Prof. Oliver Mußhoff are agricultural economists in Halle (Saale) and Göttingen, Germany. Prof. Claudia Becker is an economic statistician in Halle (Saale). The authors are interested in connecting with economists who have an interest to further concrete steps that help prevent inferential errors associated with conventional significance declarations in econometric studies.
[From the blog “‘Retire Statistical Significance’: The discussion” by Andrew Gelman, posted at Statistical Modeling, Causal Inference, and Social Science]
“So, the paper by Valentin Amrhein, Sander Greenland, and Blake McShane that we discussed a few weeks ago has just appeared online as a comment piece in Nature, along with a letter with hundreds (or is it thousands?) of supporting signatures.”
“Following the first circulation of that article, the authors of that article and some others of us had some email discussion that I thought might be of general interest.”
“I won’t copy out all the emails, but I’ll share enough to try to convey the sense of the conversation, and any readers are welcome to continue the discussion in the comments.”
…
“As noted above, I accept the continued existence and influence of mob, elites, gatekeepers, and consensus. But I’m also bothered by these, and I like to go around them when I can.”
“Hence, I’m posting this on the blog, where we have the habit of reasoned discussion rather than mob-like rhetorical violence, where the comments have no gatekeeping (in 15 years of blogging, I’ve had to delete less than 5 out of 100,000 comments—that’s 0.005%!—because they were too obnoxious), and where any consensus is formed from discussion that might just lead to the pluralistic conclusion that sometimes no consensus is possible. And by opening up our email discussion to all of you, I’m trying to demystify (to some extent) the elite discourse and make this a more general conversation.”
[From the article “Insights into Criteria for Statistical Significance from Signal Detection Analysis” by Jessica Witt, published in Meta-Psychology]
“… the best criteria for statistical significance are ones that maximize discriminability between real and null effects, not just those that minimize false alarms. One analytic technique that is intended to measure the discriminability of a test is signal detection theory…”
“Signal detection analysis involves categorizing outcomes into four categories. Applied to criteria for statistical significance, a hit occurs when there is a true effect and the analysis correctly identifies it as significant (see Table 1). A miss occurs when there is a true effect but the analysis identifies it as not significant. A correct rejection occurs when there is no effect and the analysis correctly identifies it as not significant, and a false alarm occurs when there is no effect but the analysis identifies it as significant.”
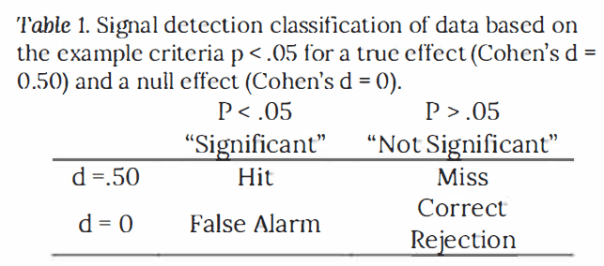
“In statistics, Type I errors (false alarms) and Type II errors (misses) are sometimes considered separately, with Type I errors being a function of the alpha level and Type II errors being a function of power. An advantage of signal detection theory is that it combines Type I and Type II errors into a single analysis of discriminability…”
“…p values were effective, though not perfect, at discriminating between real and null effects.”
“Bayes factor incurs no advantage over p values at detecting a real effect versus a null effect … This is because Bayes factors are redundant with p values for a given sample size.”
“When power is high, researchers using p values to determine statistical significance should use a lower criterion.”
“… a change to be more conservative will decrease false alarm rates at the expense of increasing miss rates. False alarm rates should not be considered in isolation without also considering miss rates. Rather, researchers should consider the relative importance for each in deciding the criterion to adopt.”
“…given that true null results can be theoretically interesting and practically important, a conservative criterion can produce critically misleading interpretations by labeling real effects as if they were null effects.”
“Moving forward, the recommendation is to acknowledge the relationship between false alarms and misses, rather than implement standards based solely on false alarm rates.”
To read the article, click here.
[From the blog, “Opening up the analysis behind Elizabeth Warren’s wealth tax plan” posted at BITSS]
“Senator Elizabeth Warren declared her 2020 presidential bid on a platform based on policies to rebuild the American middle-class. A key part of her campaign will be a progressive wealth tax on the net worth of American households, including a 2% tax on net worth above $50 million, and an additional 1% tax on net worth above $1 billion.”
“UC Berkeley economists Emmanuel Saez and Gabriel Zucman—the researchers whose analysis forms the basis of the plan—estimate that “75,000 American households (less than 0.1%) would be liable for the wealth tax and that the tax would raise around $2.75 trillion” in the first ten years of its implementation.”
“…Saez and Zucman teamed up with BITSS to “open up” their analysis, publicly sharing all their data and methods to make it possible for anyone to assess its validity and credibility. Having worked with researchers in academia to tackle the credibility crisis in the social sciences by improving the transparency and reproducibility of research, BITSS is now looking to apply relevant lessons to policy analysis.”
“…the team developed an interactive plot to simulate the results of the analysis for different parameters…; an ‘open policy report‘ that details all data, code, and assumptions behind the analysis; and an open online repository that stores all materials necessary to reproduce the analysis from scratch. Using the interactive plot, readers can alter the number of tax brackets, apply different rates to each, and even adjust the estimated tax evasion rate, observing how each alteration affects the tax burden, tax base and projected revenue.”
“The open policy report then goes a step further, and details how Saez and Zucman constructed each parameter, spelling out each assumption behind the proposal, including their estimated tax evasion rate, one of the proposal’s most contentious elements. Finally, readers can download all materials from the online repository, and recreate the analysis in full with minimal effort.”
[From the article, “Effect of Impact Factor and Discipline on Journal Data Sharing Policies” by David Resnik et al., published in Accountability in Research]
“…we coded … 447 journals … The breakdown was: 18.1% biological sciences, 18.8% clinical sciences, 21.7% mathematical sciences, 19.9% physical sciences.”
“Of the 447 journals evaluated, only 12 journals (2.7%) required data sharing as a condition of publication, and 35 (7.8%) required data sharing but did not explicitly state the effect on publication.”
“A total of 181 (40.5%) encouraged or addressed data sharing but did not require it, … 43.6% of the journals (195) did not mention data sharing at all.”
“Biological science journals in our subset were more likely than social science and mathematics journals to require data sharing…”
“Reproducibility and reuse should be important in any field of science, so it is somewhat surprising that biological science journals are more likely to refer to this concept in data sharing policies than journals from other types of science, especially since reproducibility problems have emerged in the clinical and social sciences (Collins and Tabal 2014, Open Science Collaboration 2015).”
“It remains to be seen whether journals outside of biology will start to place more emphasis on reproducibility as they deal with problems related to adherence to this important scientific norm.”
To read the article, click here.
[From the blog ““Abandon / Retire Statistical Significance”: Your chance to sign a petition!” by Andrew Gelman, posted at StatsBlogs]
“Valentin Amrhein, Sander Greenland, and Blake McShane write:”
“We have a forthcoming comment in Nature arguing that it is time to abandon statistical significance. The comment serves to introduce a new special issue of The American Statistician on “Statistical inference in the 21st century: A world beyond P < 0.05”. It is titled “Retire Statistical Significance”—a theme of many of the papers in the special issue including the editorial introduction—and it focuses on the absurdities generated by so-called ‘proofs of the null’.”
“Nature has asked us to recruit “co-signatories” for the comment … and we think readers of your blog would be interested. If so, we would be delighted to send a draft to interested parties for signature . Please request a copy at retire.significance2019@gmail.com and we will send it (Nature has a very strict embargo policy so please explicitly indicate you will keep it to yourself) or, if you already agree with the message, please just sign here. The timeline is tight so we need endorsements by Mar 8…”
“I signed the form myself! I like their paper and agree with all of it, with just a few minor issues.”
[From the blog “(back to basics:) How is statistics relevant to scientific discovery?” by Andrew Gelman, posted at Statistical Modeling, Causal Inference, and Social Science]
“If we are discouraged from criticizing published work—or if our criticism elicits pushback and attacks from the powerful, or if it’s too hard to publish criticisms and obtain data for replication—that’s bad for discovery, in three ways.”
“First, criticizing errors allows new science to move forward in useful directions. We want science to be a sensible search, not a random walk.”
“Second, learning what went wrong in the past can help us avoid errors in the future. That is, criticism can be methodological and can help advance research methods.”
“Third, the potential for criticism should allow researchers to be more free in their speculation. If authors and editors felt that everything published in a top journal was gospel, there could well be too much caution in what to publish.”
“Just as, in economics, it is said that a social safety net gives people the freedom to start new ventures, in science the existence of a culture of robust criticism should give researchers a sense of freedom in speculation, in confidence that important mistakes will be caught.”
“Along with this is the attitude, which I strongly support, that there’s no shame in publishing speculative work that turns out to be wrong. We learn from our mistakes. Shame comes not when people make mistakes, but rather when they dodge criticism, won’t share their data, refuse to admit problems, and attack their critics.”
“We want to encourage scientists to play with new ideas. To this purpose, I recommend the following steps:”
– “Reduce the costs of failed experimentation by being more clear when research-based claims are speculative.”
– “React openly to follow-up studies. Once you recognize that published claims can be wrong (indeed, that’s part of the process), don’t hang on to them too long or you’ll reduce your opportunities to learn.”
– “Publish all your data and all your comparisons (you can do this using graphs so as to show many comparisons in a compact grid of plots). If you follow current standard practice and focus on statistically significant comparisons, you’re losing lots of opportunities to learn.”
– “Avoid the two-tier system. Give respect to a student project or Arxiv paper just as you would to a paper published in Science or Nature.”
“We should all feel free to speculate in our published papers without fear of overly negative consequences in the (likely) event that our speculations are wrong; we should all be less surprised to find that published research claims did not work out (and that’s one positive thing about the replication crisis, that there’s been much more recognition of this point); and we should all be more willing to modify and even let go of ideas that didn’t happen to work out, even if these ideas were published by ourselves and our friends.”
In July 2017, Economics: The Open Access, Open Assessment E-Journal issued a call for papers for a special issue on the practice of replication. The call stated, “This special issue is designed to highlight alternative approaches to doing replications, while also identifying core principles to follow when carrying out a replication. Contributors to the special issue will each select an influential economics article that has not previously been replicated, with each contributor selecting a unique article. Each paper will discuss how they would go about “replicating” their chosen article, and what criteria they would use to determine if the replication study “confirmed” or “disconfirmed” the original study.”
The special issue was published late last year, with an accompanying “Takeaways” commentary appearing early this year. A total of eight articles were published in the special issue. The authors and paper titles are identified below. What follows are some thoughts from that exercise.

Replications in economics are different from replications in psychology
The first takeaway from the special issue is that replications in economics are different from replications in psychology. It is common in psychology to categorize replications discretely into two categories: direct and conceptual. A good example of this is provided by the website Curate Science, which identifies a continuum of replications running from “direct” to “conceptual”.

Psychology replications are more easily fitted onto a one-dimensional scale. Replications in psychology generally involve experiments. A typical concern is whether, and how closely, the replication matches the original study’s experimental design and implementation.
In contrast, most empirical economic studies are based on observational, versus experimental, data (experimental/behavioral economics being a notable exception). Problems that consume economic studies, such as endogeneity or non-stationarity, are not major concerns in psychology. This cuts down on the need for a vast arsenal of econometric procedures and reduces the relative importance of alternative statistical methodologies.
Another major difference is that the number of variables and observations that characterize observational studies are large relative to studies that use experimental data. Datasets in economics often have hundreds of potential variables and many thousands of observations. As a result, the garden of forking paths is bigger in economics. With more paths to explore, there is greater value in re-analyzing existing data to check for robustness.
The bottom line is that economic replications are not easily compressed onto a one-dimensional scale. Consider the following two-dimensional taxonomy for replications in economics:

Here the dimension of measurement and analysis is distinguished from the dimension of target population. While I know of no data to support this next statement, I conjecture that a far greater share of replication studies in economics are concerned with the “vertical dimension” of empirical procedures.
In fact, this is exactly what shows in the eight studies of the special issue. The table below sorts the eight studies across the two dimensions of target population and methodology. Noteworthy is that most of the replications focus on re-analyzing the same data, either using the same or different empirical procedures. Only one study has interest in exploring the “boundaries” that determine the external validity of the original study.

Unless I am mistaken, this is also another difference with psychology. It seems to me that psychology has a greater interest in understanding effect heterogeneity. For example, an original study reports that men are more upset than women when their partner commits a sexual versus emotional infidelity. The original study found this result for a sample of young people (Buss et al., 1999). A later replication was interested in exploring this result for older people (Shackleford et al., 2004). It is my sense, again stated without supporting evidence, that these kinds of replication studies are more common in psychology than in economics. In my opinion, this is a shortcoming of replications in economics.
Compressing replications into the one-dimensional taxonomy common in psychology loses the distinction between replications focused on measurement and empirical procedures, and replications focused on establishing boundaries for external validity. Blurring this distinction may not be a great loss for psychology, but it is for economics, because it can hide “gaps” in the things that economic replications study (e.g., effect heterogeneity).
Whatever you call replications, you should call them replications
Does it make a difference? Yes, it makes a huge difference. But not for the reason most people give. Most commentators argue for a particular classification system in order to distinguish different types of replications. Much more important than distinguishing different shades of replications is that the literature be able to distinguish, and identify, replications from other types of empirical studies.
The biggest problem with replications is being able to find them. The confusing tangle of alternative replication vocabularies is not helping. For replications to make a difference, researchers need to know of their existence. They need to be easily identifiable in search algorithms. If a study calls itself a “re-analysis” rather than a replication, a researcher who searches for replications may miss it. Who cares about the fine point of distinguishing one type of replication from another when the replication is never read?
I don’t know which taxonomy is best. But I believe that all taxonomies should have the word “replication” in each of the categories so that they can be easily identified by search algorithms. Thus, I don’t care if somebody wants to use “Pure replication”/“Statistical replication”/ “Scientific replication”, or “Verification replication”/“Reproduction replication”/ “Re-analysis replication”/“Extension replication”, as long as the word “replication” appears in the text, ideally in the abstract. That makes it easy for search algorithms to find the paper, which is crucial if the paper is to be read.
There is no single standard for replication success
The eight papers in the special issue offered a variety of criteria for “replication success”. How one defines replication “success” depends on the goal of the replication. If the goal is to double check that the numbers in a published study are correct, then, as McCullough emphasizes, anything less than 100% reproduction is a failure: “For linear procedures with moderately-sized datasets, there should be ten digit agreement, for nonlinear procedures there may be as few as four or five digits of agreement” (McCullough, 2018, page 3).
Things become complicated if, instead, the goal is to determine if the claim from an original study is “true.” This is illustrated by the variety of criteria for replication “success” offered by the studies of the special issue. For Hannum, success depends on the significance of the estimated coefficient of a key variable. Owen suggests a battery of tests based upon significance testing, but acknowledges “fallacies of acceptance and rejection” as challenges to interpreting test results. Coupé proposes counting all the parameters that are reproduced exactly and calculating a percentage correct index, perhaps weighted by the importance of the respective parameters. Daniels & Kakar identify success if the replicated parameters have “the same size and significance for all specifications”, though they do not define what constitutes “the same”. Wood & Vasquez shy away from even using the words “success” or “failure”. Instead, they see the purpose of replication as contributing to a “research dialogue”. They advocate a holistic approach, “looking for similar coefficient sizes, direction of coefficients, and statistical significance”.
The nut of the problem is illustrated by Reed (2018) in the following example: “Suppose a study reports that a 10% increase in unemployment benefits is estimated to increase unemployment duration by 5%, with a 95% confidence interval of [4%, 6%]. Two subsequent replications are undertaken. Replication #1 finds a mean effect of 2% with corresponding confidence interval of [1%, 3%]. Replication #2 estimates a mean effect of 5%, but the effect is insignificant with a corresponding confidence interval of [0%, 10%]. In other words, consistent with the original study, Replication #1 finds that unemployment durations are positively and significantly associated with unemployment insurance benefits. However, the estimated effect falls significantly short of the effect reported by the original study. Replication #2 estimates a mean effect exactly the same as the original, but due to its imprecision, the effect is statistically insignificant. Did either of the two replications “successfully replicate” the original? Did both? Did none?”
This problem is not unique to economics and observational studies. Despite the fact that many experimental studies define success as “a significant effect in the same direction as the original study” (Camerer et al., 2018), there exist many definitions of “replication success” in the experimental literature. Open Science Collaboration (2015) used five definitions of replication success. And Curate Science identifies six outcomes for categorizing replication outcomes (see below).

This has important implications for assessments of the “reproducibility” of science. For example, the recently announced, DARPA-funded, SCORE Project (“Systematizing Confidence in Open Research and Evidence”) intends to develop algorithms for assessing approximately 30,000 findings from the social-behavioral sciences. Towards that end, experts will “review and score about 3,000 of those claims in surveys, panels, or prediction markets for their likelihood of being reproducible findings.” The criteria used to define “replication success” will have a huge influence on the results of the project, and the interpretation of those results.
The value of pre-registration
Pre-registration has received much attention by the practitioners of open science. There is hope that pre-registration can help solve the “replication crisis.” As part of a series on pre-registration hosted by the Psychonomic Society, Klaus Oberauer argues that our efforts should not be focused on pre-registration, but on making data and code available so other researchers can explore alternative forking paths: “If there are multiple equally justifiable analysis paths, we should run all of them, or a representative sample, to see whether our results are robust. … making the raw data publicly available enables other researchers … to run their own analyses … It seems to me that, once publication of the raw data becomes common practice, we have all we need to guard against bias in the choice of analysis paths without giving undue weight to the outcome of one analysis method that a research team happens to preregister.”
I agree with Oberauer that the bigger issue is making data and code available. As is ensuring that there are outlets to publish the results of replications. However, even if data and code are ubiquitous and replications publishable, there will still be value in pre-registering replication studies. In assessing the results of a replication study, there is a difference in how one interprets “I did one thing that I thought was most important and the results did not replicate” and “I did 10 things looking for problems and found one thing that didn’t replicate.” Pre-registration can establish which of these applies.
Bob Reed is a professor of economics at the University of Canterbury in New Zealand. He is also co-organizer of the blogsite The Replication Network. He can be contacted at bob.reed@canterbury.ac.nz.
[From the article “Assessing data availability and research reproducibility in hydrology and water resources” by Stagge, Rosenberg, Abdallah, Akbar, Attallah & James, published in Nature’s Scientific Data]
“…reproducibility requires multiple, progressive components such as (i) all data, models, code, directions, and other digital artifacts used in the research are available for others to reuse (hereafter, “availability”), (ii) the artifacts can be used to exactly reproduce published results (reproducibility, sometimes called bit or computational reproducibility;), and (iii) existing and new datasets can be processed using the artifacts to reproduce published conclusions (replicability).”
“To quantify the current state of reproducible science in hydrology and to understand the factors preventing more reproducible or replicable publications, we present here a 15-question survey tool designed to assess the availability of digital artifacts and replicability of results in peer-reviewed journal articles. We use this survey tool to assess 360 random-sampled articles from the 1,989 articles published in 2017 across six reputable hydrology and water resources journals. “
“Applying our survey tool to 360 random-sampled hydrology articles published in 2017 shows that a decreasing number of articles are able to satisfy the progressively stricter reproducibility requirements of artifact availability and ultimately reproduction of the published results. For example, 70.3% of the 360 sampled articles stated some materials were available, but we could only access 48.6% of those materials online. Only 5.6% of sampled articles made data, model/code, and directions publicly available while just 1.1% of sampled articles made artifacts available and were fully reproduced. We partially reproduced an additional 0.6% of articles.”
“Our findings of low reproducibility of research published in six hydrology and water resources journals in 2017 mirrors low rates of reproducibility previously reported in psychology (100 experiments), computer systems research (613 articles), and articles published in Science (204 articles). Unlike those studies, our survey tool additionally identified bottlenecks to making all digital artifacts available and reproducing results.”
“…we discuss how results for our study in hydrology and water resources can inform broader use of the survey tool by authors, journals, funders, and institutions to improve the reproducibility of published scientific research.”
To read the article, click here.
[From the article “Will scientific error checkers become as ubiquitous as spell-checkers?” posted at Retraction Watch]
“Jonathan Wren and Constantin Georgescu of the Oklahoma Medical Research Foundation used an algorithmic approach to mine abstracts on MEDLINE for statistical ratios (e.g., hazard or odds ratios), as well as their associated confidence intervals and p-values. They analyzed whether these calculations were compatible with each other. (Wren’s PhD advisor, Skip Garner, is also known for creating such algorithms, to spot duplications.)”
“After analyzing almost half a million such figures, the authors found that up to 7.5% were discrepant and likely represented calculation errors. When they examined p-values, they found that 1.44% of the total would have altered the study’s conclusion (i.e., changed significance) if they had been performed correctly.”
“We asked Wren — who says he thinks automatic scientific error-checkers will one day be as common as automatic spell-checkers are now — to answer a few questions about his paper’s approach.”
To read the interview, click here.

You must be logged in to post a comment.