An oft-overlooked detail in the significance debate is the challenge of calculating correct p-values and confidence intervals, the favored statistics of the two sides. Standard methods rely on assumptions about how the data were generated and can be way off when the assumptions don’t hold. Papers on heterogenous effect sizes by Kenny and Judd and McShane and Böckenholt present a compelling scenario where the standard calculations are highly optimistic. Even worse, the errors grow as the sample size increases, negating the usual heuristic that bigger samples are better.
Standard methods like the t-test imagine that we’re repeating a study an infinite number of times, drawing a different sample each time from a population with a fixed true effect size. A competing, arguably more realistic, model is the heterogeneous effect size model (het). This assumes that each time we do the study, we’re sampling from a different population with a different true effect size. Kenny and Judd suggest that the population differences may be due to “variations in experimenters, participant populations, history, location, and many other factors… we can never completely specify or control.”
In the meta-analysis literature, the het model is called the “random effects model” and the standard model the “fixed effects model”. While the distinction is well-recognized, the practical implications may not be. The purpose of this blog is to illustrate the practical consequences of the het model for p-values and confidence intervals.
I model the het scenario as a two stage random process. The first stage selects a population effect size, dpop, from a normal distribution with mean dhet and standard deviation sdhet. The second carries out a two group difference-of-mean study with that population effect size: it selects two random samples of size n from standard normal distributions, one with mean=0 and the other with mean=dpop, and uses standardized difference, aka Cohen’s d, as the effect size statistic. The second stage is simply a conventional study with population effect size dpop. dhet, the first stage mean, plays the role of true effect size.
Figure 1 shows a histogram of simulated het results under the null (dhet=0) with sdhet=0.2 for n=200. Overlaid on the histogram is the sampling distribution for the conventional scenario colored by conventional p-value along with the 95% confidence interval. Note that the histogram is wider than the sampling distribution.
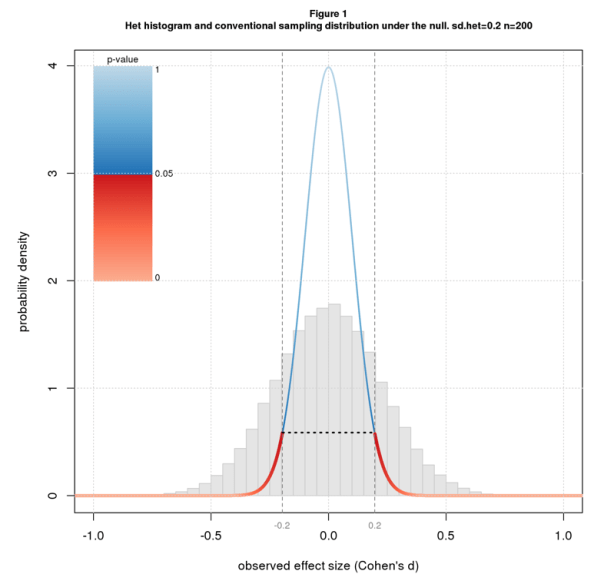
Recall that the p-value for an effect d is the probability of getting a result as or more extreme than d under the null. Since the histogram is wider than the sampling distribution, it has more data downstream of the point where p=0.05 (where the color switches from blue to red) and so the correct p-value is more than 0.05. In fact the correct p-value is much more: 0.38. The confidence interval also depends on the width of the distribution and is wider than for the conventional case: -0.44 to 0.44 rather than -0.20 to 0.20.
Note that effect size heterogeneity “inflates” both the true p-value and true confidence interval. In this particular example, p-value inflation is 7.6 ( 0.38/0.05), and confidence interval inflation is 2.2 (0.44/0.20). In general, these inflation factors will change with sdhet and n. Figures 2 and 3 plot p-value and confidence interval inflation vs. n for several values of sdhet. The p-value results (Figure 2) show inflation when the conventional p-value is barely significant (p=0.05); the confidence interval results (Figure 3) are for d=0 (same as Figure 1).
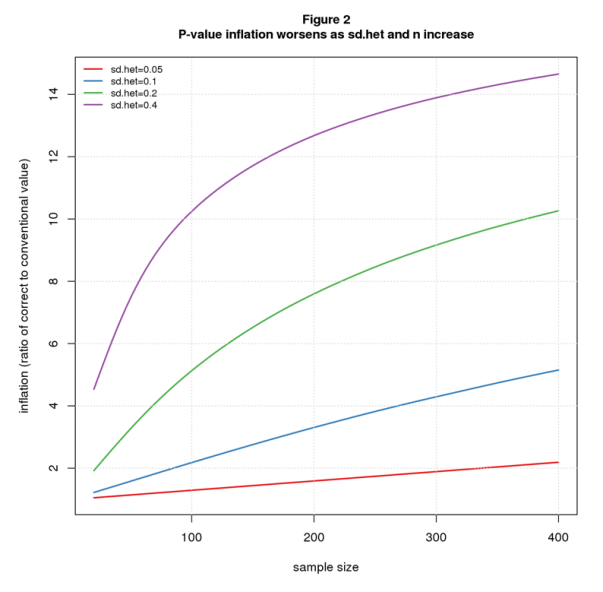
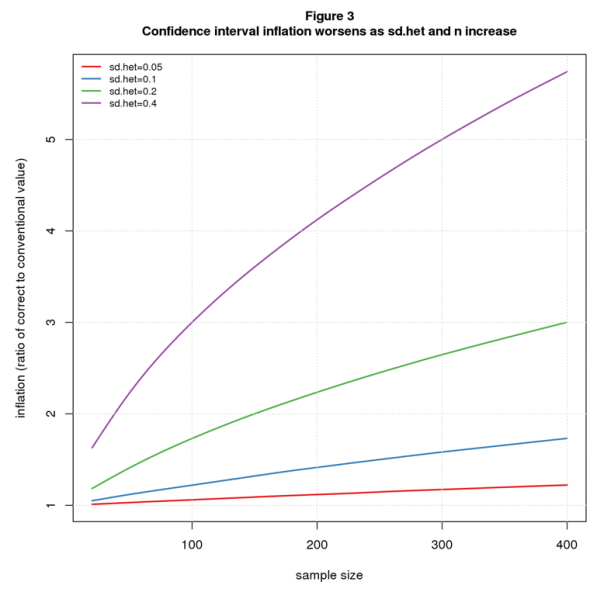
Not surprisingly, the results get worse as heterogeneity increases. For n=200, p-value inflation grows from 1.59 when sdhet=0.05 to 12.68 for sdhet=0.4; over the same range, confidence interval inflation grows from 1.12 to 4.12.
More worrisome is that the problem also gets worse as the sample size increases. For sdhet=0.05, p-value inflation grows from a negligible 1.05 when n=20 to 1.59 for n=200 and 2.19 for n=400; the corresponding values for confidence interval inflation are 1.01, 1.12, and 1.22. For sdhet=0.2, p-value inflation grows from 1.90 for n=20 to 10.26 for n=400, while confidence interval inflation increases from 1.18 to 3.00.
What’s driving this sample size dependent inflation is that increasing n tightens up the second stage (where we select samples of size n) but not the first (where we select dpop). As n grows and the second stage becomes narrower, the unchanging width of the first stage becomes proportionally larger.
Another way to see it is to compare the sampling distributions. Figure 4 shows sampling distributions for n=20 and n=200 for the conventional scenario (colored by p-value) and the het scenario (in grey) for sdhet=0.2. For n=20, the het (grey) curve is only slightly wider than the conventional one, while for n=200 the difference is much greater. In both scenarios, the distributions are tighter for the larger n, but the conventional curve gets tighter faster.

If you believe that the heterogeneous effects model better depicts reality than the conventional model, it follows that p-values and confidence intervals computed by standard statistical packages are too small. Further, it’s impossible to know how much they should be adjusted.
Is this another argument for “retiring statistical significance?” Maybe. But even if one wants to keep significance on the payroll, these results argue for giving less weight to p-values and confidence intervals when assessing the results of statistical tests. More holistic and, yes, subjective interpretations are warranted.
Comments Please!
Nat Goodman is a retired computer scientist living in Seattle Washington. His working years were split between mainstream CS and bioinformatics and orthogonally between academia and industry. As a retiree, he’s working on whatever interests him, stopping from time-to-time to write papers and posts on aspects that might interest others.
In 2015, Crépon, Devoto, Duflo and Pariente (2015, henceforth CDDP), published the results of a randomized control trial (RCT) in a special issue of the AEJ: Applied Economics. CDDP evaluated the impact of a microcredit program conducted in Morocco with Al Amana, Morocco’s largest microcredit institution. Their total sample consisted of 5,551 households spread across 162 rural villages. They concluded that microcredit had substantial, significant impacts on self-employment assets, outputs, expenses and profits.
We replicated their paper and identified a number of issues that challenge their conclusions. In this blog, we briefly summarize the results of our analysis and then offer ten lessons learned from this research effort. Greater detail about our replication can be found in our recently published paper in the International Journal for the Re-Views of Empirical Economics.
A Summary of Key Results from Our Replication
We found that CDDP’s results depend heavily on how one trims the data. CDDP used two different trimming criteria for their baseline and endline samples. We illustrate the fragility of their results by showing that they are not robust to small changes in the trimming thresholds at endline. Using a slightly looser criterion produces insignificant results for self-employment outputs (sales and home consumption) and profits. Applying a slightly stricter criterion generates significant positive impacts on expenses, significant negative impacts on investment, and insignificant impacts on profits. The latter results defy a coherent interpretation.
We found substantial and significant imbalances in the baseline for a number of important variables, including on the outcome variables of this RCT.
Perhaps relatedly, we estimated implausible “treatment effects” on some variables: For example, we found significant “treatment effects” for household head gender and spoken language.
We documented numerous coding errors. The identified coding errors altered approximately 80% of the observations. Correcting these substantially modify the estimated average treatment effects.
There were substantial inconsistencies between survey and administrative data. For example, the administrative data used by CDDP identified 435 households as clients, yet 241 of these said they had not borrowed from Al Amana. Another 152 households self-reported having a loan from Al Amana, but were not listed as borrowers in Al Amana’s records.
We found sampling errors. For example, the sex and age composition for approximately 20% of the households interviewed at baseline and supposedly re-interviewed at endline differs to such an extent that it is implausible that the same units were re-interviewed in these cases.
We show in our paper that correcting these data problems substantially affects CDDP’s results.
In addition, we found that CDDP’s sample characteristics differed in important ways from population characteristics, raising questions about the representativeness of the sample, and hence, external validity.
Ten Lessons Learned
The following are ten lessons that we learned as a result of our replication, with a focus on development economics.
1) Peer review cannot be relied upon to prevent suspect data analyses from being published, even at top journals such as the AEJ:AE. While some of the data issues we document would be difficult to identify without a careful re-working of the data, others were more obvious and should have been spotted by reviewers.
2) Replication, and more specifically, verification tests (Clemens, 2017), should play a more prominent role in research. Sukhtantar (2017) systematically reviewed development economics articles published in ten top-ranking journals since 2000. Of 120 RCTs, he found 15 had been replicated. Only two of these had been subjected to verification tests, in which the original data are examined for data, coding, and/or sampling flaws. This suggests that development economists generally assume that the data, sampling and programming code that underlie published research are reliable. A corollary is that multiple replications/verification tests may be needed to uncover problems in a study. For example, CDDP has been subject to two previous replications involving verification testing (Dahal & Fiala 2018; Kingi et al. 2018). These missed the errors we identified in our replication.
3) The discipline should do more to encourage better data analysis, as separate from econometric methodology. Researchers rarely receive formal training in programming and data handling. However, generic recommendations exist (Wickham 2014; Peng 2011; Cooper et al. 2017). These should be better integrated into researcher training.
4) Empirical studies should publish the raw data used for their analyses whenever possible. Our replication was feasible because the authors and the journal shared the data and code used to produce the published results. Although the AEJ:AE data availability policy[1] states that raw data should be made available, this is not always the case. Raw data were available for just three of the six RCTs in the AEJ:AE 7(1) special issue on microcredit (Crépon et al. 2015; Attanasio et al. 2015; Augsburg et al. 2015). A subset of pre-processed data was available for two other RCTs (Banerjee et al. 2015; Angelucci, Karlan, & Zinman 2015). While the Banerjee et al. article included a URL link to the raw data, the corresponding website no longer exists.
5) Survey practices for RCTs should be improved. Data quality and sampling integrity are systematically analyzed for standard surveys (such as the Demographic and Health Surveys and Living Standards Measurement Surveys) and are reported in the survey reports’ appendices. Survey methods and practices used for RCTs should be aligned with the quality standards established for household surveys conducted by national statistical systems (Deaton 1997; United Nations Statistical Division 2005). This implies adopting sound unit definitions (household, economic activity, etc.), drawing on nationally tried-and-tested questionnaire models, working with professional statisticians with experience of quality surveys in the same country (ideally nationals), properly training and closely supervising survey interviewers and data entry clerks, and analyzing and reporting measurement and sampling errors.
6) RCT reviews should pay greater attention to imbalances at baseline. Many RCTs do not collect individual-level baseline surveys (4 in 6 did so in the AEJ:AE special issue on microcredit, Meager 2015), and some randomization proponents go so far as to recommend dropping baseline surveys to concentrate more on running larger endline surveys (Muralidharan 2017). RCTs need to include baseline surveys that offer the same statistical power as their endline surveys to ensure that results at endline are not due to sampling bias at baseline.
7) RCT reviews should also pay close attention to implausible impacts at endline in order to detect sampling errors, such as the household identification errors observed in CDDP. This can also reveal flaws in experiment integrity, such as co-intervention and data quality issues.
8) Best practice should be followed with respect to trimming. Deaton and Cartwright (A. Deaton & Cartwright 2016: 1) issued the following warning about trimming in RCTs, “When there are outlying individual treatment effects, the estimate depends on whether the outliers are assigned to treatments or controls, causing massive reductions in the effective sample size. Trimming of outliers would fix the statistical problem, but only at the price of destroying the economic problem; for example, in healthcare, it is precisely the few outliers that make or break a programme.” In general, setting fixed cut-offs for trimming lacks objectivity and is a source of bias, as it does not take into account the structure of the data distribution. Best practice for trimming experimental data consists of using a factor of standard deviation and, ideally, defining this factor based on sample size (Selst & Jolicoeur 1994).
9) RCTs should place their findings in the context of related, non-RCT studies. In their article, CDDP cite 17 references: nine RCTs, four on econometric methodology, three non-RCT empirical studies from India and one economic theory paper. No reference is made to other studies on Morocco, microcredit particularities or challenges encountered with this particular RCT. This is especially surprising since this RCT was the subject of debate in a number of published papers prior to CDDP, all seeking to constructively comment on and contextualize this Moroccan RCT (Bernard, Delarue, & Naudet 2012; Doligez et al. 2013; Morvant-Roux et al. 2014). These references help explain a number of the shortcomings that we identified in our replication.
10) RCTs are over-weighted in systematic reviews. Currently, RCTs dominate systematic reviews. The CDDP paper has already been cited 248 times and is considered a decisive contribution with respect to a long-standing debate on the subject (Ogden 2017). The substantial concerns we raise suggest that CDDP should not a priori be regarded as more reliable than the 154 non-experimental impact evaluations on microcredit that preceded it (Bédécarrats 2012; Duvendack et al. 2011).
Florent Bédécarrats works in the evaluation unit of the French Development Agency (AFD). Isabelle Guérin and François Roubaud are both senior research fellows of the French national Research Institute for Sustainable Development (IRD). Isabelle is a member of the Centre for Social Science Studies on the African, American and Asian Worlds and François is a member of the Joint Research Unit on Development, Institutions and Globalization (DIAL). Solène Morvant-Roux is Assistant Professor at the Institute of Demography and Socioeconomics at the University of Geneva. The opinions expressed are those of the authors and are not attributable to the AFD, the IRD or the University of Geneva. Correspondence can be directed to Florent Bédécarrats at bedecarratsf@afd.fr
References
Angelucci, Manuela, Dean Karlan, Jonathan Zinman. 2015. « Microcredit impacts: Evidence from a randomized microcredit program placement experiment by Compartamos Banco ». American Economic Journal: Applied Economics 7 (1): 151-82 [available online].
Attanasio, Orazio, Britta Augsburg, Ralph De Haas, Emla Fitzsimons, Heike Harmgart. 2015. « The impacts of microfinance: Evidence from joint-liability lending in Mongolia ». American Economic Journal: Applied Economics 7 (1): 90-122 [available online].
Augsburg, Britta, Ralph De Haas, Heike Harmgart, Costas Meghir. 2015. « The impacts of microcredit: Evidence from Bosnia and Herzegovina ». American Economic Journal: Applied Economics 7 (1): 183-203 [available online].
Banerjee, Abhijit, Esther Duflo, Rachel Glennerster, Cynthia Kinnan. 2015. « The miracle of microfinance? Evidence from a randomized evaluation ». American Economic Journal: Applied Economics 7 (1): 22-53 [available online].
Bédécarrats, Florent. 2012. « L’impact de la microfinance : un enjeu politique au prisme de ses controverses scientifiques ». Mondes en développement 158: 127‑42 [available online].
Bédécarrats, Florent, Isabelle Guérin, Solène Morvant-Roux, François Roubaud. 2019. « Estimating microcredit impact with low take-up, contamination and inconsistent data. A replication study of Crépon, Devoto, Duflo, and Pariente (American Economic Journal: Applied Economics, 2015) ». International Journal for Re-Views in Empirical Economics 3 (2019‑3) [available online].
Bernard, Tanguy, Jocelyne Delarue, Jean-David Naudet. 2012. « Impact evaluations: a tool for accountability? Lessons from experience at Agence Française de Développement ». Journal of Development Effectiveness 4 (2): 314-327 [available online].
Clemens, Michael 2017. « The meaning of failed replications: A review and proposal ». Journal of Economic Surveys 31 (1): 326-342 [available online].
Cooper, Natalie, Pen-Yuan Hsing, Mike Croucher, Laura Graham, Tamora James, Anna Krystalli, Francois Michonneau. 2017. « A guide to reproducible code in ecology and evolution ». British Ecological Society [available online].
Crépon, Bruno, Florencia Devoto, Esther Duflo, William Parienté. 2015. « Estimating the impact of microcredit on those who take it up: Evidence from a randomized experiment in Morocco ». American Economic Journal: Applied Economics 7 (1): 123-50 [available online].
Dahal, Mahesh, Nathan Fiala. 2018. « What do we know about the impact of microfinance? The problems of power and precision ». Ruhr Economic Papers [available online].
Deaton, Angus, Nancy Cartwright. 2016. « The limitations of randomized controlled trials ». VOX: CEPR’s Policy Portal (blog). 9 novembre 2016 [available online].
Deaton, Angus. 1997. The Analysis of Household Surveys: A Microeconometric Approach to Development Policy. Baltimore, MD: World Bank Publications [available online].
Doligez, François, Florent Bédécarrats, Emmanuelle Bouquet, Cécile Lapenu, Betty Wampfler. 2013. « Évaluer l’impact de la microfinance : Sortir de la “double impasse” ». Revue Tiers Monde, no 213: 161‑78 [available online].
Duvendack, Maren, Richard Palmer-Jones, James Copestake, Lee Hooper, Yoon Loke, Nitya Rao. 2011. What is the Evidence of the Impact of Microfinance on the Well-Being of Poor People? Londres: EPPI-University of London [available online].
Kingi, Hautahi, Flavio Stanchi, Lars Vilhuber, Sylverie Herbert. 2018. « The Reproducibility of Economics Research: A Case Study ». presented at Berkeley Initiative for Transparency in the Social Sciences Annual Meeting, Berkeley [available online].
Meager, Rachael. 2015. « Understanding the Impact of Microcredit Expansions: A Bayesian Hierarchical Analysis of 7 Randomised Experiments ». arXiv:1506.06669[available online].
Morvant-Roux, Solène, Isabelle Guérin, Marc Roesch, Jean-Yves Moisseron. 2014. « Adding Value to Randomization with Qualitative Analysis: The Case of Microcredit in Rural Morocco ». World Development 56 (avril): 302‑12 [available online].
Muralidharan, Karthik. 2017. « Field Experiments in Education in Developing Countries ». In Handbook of Economic Field Experiments. Elsevier.
Ogden, Timothy. 2017. Experimental Conversations: Perspectives on Randomized Trials in Development Economics. Cambridge, Massachusetts: The MIT Press.
Peng, Roger. 2011. « Reproducible research in computational science ». Science 334 (6060): 1226-1227.
Selst, Mark Van, Pierre Jolicoeur. 1994. « A solution to the effect of sample size on outlier elimination ». The quarterly journal of experimental psychology 47 (3): 631-650.
United Nations Statistical Division. 2005. Household Surveys in Developing and Transition Countries. United Nations Publications [available online].
Wickham, Hadley. 2014. « Tidy data ». Journal of Statistical Software 59 (10): 1-23 [available online].
[From the article, “Rein in the four horsemen of irreproducibility”, by Dorothy Bishop, published in Nature]
“More than four decades into my scientific career, I find myself an outlier among academics of similar age and seniority: I strongly identify with the movement to make the practice of science more robust.”
“It’s not that my contemporaries are unconcerned about doing science well; it’s just that many of them don’t seem to recognize that there are serious problems with current practices.”
“By contrast, I think that, in two decades, we will look back on the past 60 years — particularly in biomedical science — and marvel at how much time and money has been wasted on flawed research.”
To read the article, click here.
[From the working paper, “How Cluster-Robust Inference Is Changing Applied Econometrics” by James MacKinnon, posted as a Queen’s University Working Paper]
“Whenever the observations can plausibly be grouped into a set of clusters, it has become customary, indeed often mandatory, in many areas of applied econometrics to use clustered standard errors….Nevertheless, whether and how to account for clustered disturbances is still somewhat controversial.”
“I am making the (arguably very strong) assumptions that each observation belongs to one and only one cluster, that the investigator knows which cluster it belongs to, and that any correlation across observations occurs only within clusters.”
“For simplicity and concreteness, consider the linear regression model where y and u are Nx1 vectors of observations and disturbances, X is an NxK matrix of exogenous covariates, and β is a Kx1 parameter vector. With one-way clustering, which is currently the most common case, there are G clusters, indexed by g, where the gth cluster has Ng observations.”
“This yields a cluster-robust variance estimator, or CRVE, of which the most widely-used version is
“CV1 can have rank at most G-1. This makes it impossible to test hypotheses involving more than G-1 restrictions using Wald tests based on (4). Moreover, for hypotheses that involve numbers of restrictions not much smaller than G-1, the finite-sample properties of Wald tests based on (4) are likely to be very poor.”
“Allowing the disturbances to be correlated fundamentally changes the nature of statistical inference, especially for large samples. This is most easily seen in the context of estimating a population mean. Suppose we have a sample of N uncorrelated observations, yi, each with variance Var(yi) that is bounded from below and above. Then the usual formula for the variance of the sample mean [ybar] is
“From (8) it is easy to see that Var(ybar)→0 as N→∞. But this result depends crucially on the assumption that the yi are uncorrelated.”
“Without such an assumption, the variance of the sample mean would be
“…even if the Cov(yi;yj) are very small, the variance of ybar will never converge to zero as N→∞. Instead, it will ultimately converge to whatever the second term converges to.”
“…inference with clustered disturbances can be very different from inference with uncorrelated ones. When G is fixed, or increases less rapidly than N, the information contained in a sample grows more slowly than the sample size…. This implies that the amount of information about the parameters of interest contained in extremely large samples (such as the ones increasingly encountered in empirical microeconomics) may be very much less than intuition would suggest.”
“Much of the work on cluster-robust inference in recent years has focused on inference in finite samples. The meaning of finite is not the usual one, however. What matters for reliable inference is not the number of observations, N, but the number of clusters, G. In addition, both the way in which observations are distributed across clusters and the characteristics of the Xg matrices can greatly affect the reliability of finite-sample inference.”
“Suppose we are interested in one element of β, say βj . Then cluster-robust inference is typically based on the t statistic where βj0 is the value under the null hypothesis, and [Vhatjj] is the jth diagonal element of the CV1 matrix (4). The statistic tj is generally assumed to follow the Student’s t distribution with G-1 degrees of freedom.”
“Inference based on (11) and the t(G-1) distribution can sometimes work very well. It generally does so when there are at least 50 clusters and they are reasonably homogeneous, that is, similar in size and with reasonably similar Xg‘Xg and Xg‘ΩgXg matrices. However, there can be severe over-rejection when these conditions are not satisfied.”
“In most cases, the best way to perform tests of restrictions on the linear regression model (1) seems to be to use a particular version of the wild bootstrap. We first compute either a t statistic like tj or a Wald statistic … then compute a large number of bootstrap test statistics, and finally calculate a bootstrap P value that measures how extreme the actual test statistic is relative to the distribution of the bootstrap test statistics. For example, if 26 out of 999 bootstrap statistics were more extreme than the actual test statistic, the bootstrap P value would be 27/999 = 0.027.”
“The key issue for bootstrap testing is how to generate the bootstrap samples. In the case of (1), there are several plausible ways to do so. The best approach usually seems to be to use the restricted wild cluster bootstrap (WCR).”
“Provided the number of clusters is not too large, it is possible to generate a large number of wild cluster bootstrap test statistics very efficiently. This is what the Stata routine boottest does… Because using boottest is so inexpensive in most cases, it probably makes sense to employ the restricted wild cluster bootstrap by default whenever making cluster-robust inferences using Stata.”
“Reliable inference is particularly challenging when the parameter of interest is the coefficient on a treatment dummy variable, treatment is assigned at the cluster level, and there are very few treated clusters. This includes the case of difference-in-differences (DiD) regressions when all the treated observations belong to just a few clusters. It has been known for some time that using cluster-robust t statistics leads to serious over-rejection in such cases.”
[There is a] “…large and rapidly growing literature aimed at improving cluster robust inference in finite samples. A wide variety of methods is available, and it would often make sense to employ two or three of them. In many cases, but not all, the restricted wild cluster bootstrap works very well. Perhaps surprisingly, it can often be computed remarkably quickly using the Stata routine boottest.”
“As the empirical examples ,,, illustrate, inference can be very sensitive to how (and whether) the observations are clustered. In practice, investigators would therefore be wise to put a lot of thought into this. When there is more than one natural way to cluster, it generally makes sense to investigate all of them.”
[From the article, “The Meaningfulness of Effect Sizes in Psychological Research: Differences Between Sub-Disciplines and the Impact of Potential Biases” by Thomas Schäfer and Marcus Schwarz, published April 11, 2019 in Frontiers in Psychology]
“From past publications without preregistration, 900 effects were randomly drawn and compared with 93 effects from publications with pre-registration, revealing a large difference: Effects from the former (median r = 0.36) were much larger than effects from the latter (median r = 0.16). That is, certain biases, such as publication bias or questionable research practices, have caused a dramatic inflation in published effects…”
“As we have argued throughout this article, biases in analyzing, reporting, and publishing empirical data (i.e., questionable research practices and publication bias) are most likely responsible for the differences between the effect sizes from studies with and without pre-registration.”
To read the article, click here.
[From the article, “Publication bias examined in meta-analyses from psychology and medicine: A meta-meta-analysis” by Robbie van Aert, Jelte Wicherts, and Marcel van Assen, published April 12, 2019 in PlosONE]
“A large-scale data set was created with meta-analyses published between 2004 and 2014 in Psychological Bulletin and in the Cochrane Library to study the extent and prevalence of publication bias in psychology and medicine…”
“Results of p-uniform suggest that possible overestimation because of publication bias was at most minimal for subsets from Psychological Bulletin.”
“The results of our paper are not in line with previous research…Only weak evidence for the prevalence of publication bias was observed in our large-scale data set of homogeneous subsets of primary studies. No evidence of bias was obtained using the publication bias tests. Overestimation was minimal but statistically significant…”
“Based on these findings in combination with the small percentages of statistically significant effect sizes in psychology and medicine, we conclude that evidence for publication bias in the studied homogeneous subsets is weak, but suggestive of mild publication bias in both disciplines.”
To read the article, click here.
[From the preprint “Abandoning statistical significance is both sensible and practical” by Valentin Amrhein, Andrew Gelman, Sander Greenland, and Blakely McShane, available at PeerJ Preprints]
“Dr Ioannidis writes against our proposals to abandon statistical significance…”
“…we disagree that a statistical significance-based “filtering process is useful to avoid drowning in noise” in science and instead view such filtering as harmful.”
“First, the implicit rule to not publish nonsignificant results biases the literature with overestimated effect sizes and encourages “hacking” to get significance.”
“Second, nonsignificant results are often wrongly treated as zero.”
“Third, significant results are often wrongly treated as truth rather than as the noisy estimates they are, thereby creating unrealistic expectations of replicability.”
“Fourth, filtering on statistical significance provides no guarantee against noise. Instead, it amplifies noise because the quantity on which the filtering is based (the p-value) is itself extremely noisy and is made more so by dichotomizing it.”
“We also disagree that abandoning statistical significance will reduce science to “a state of statistical anarchy.” Indeed, the journal Epidemiology banned statistical significance in 1990 and is today recognized as a leader in the field.”
“The replication crisis in science is not the product of the publication of unreliable findings. … Rather, the replication crisis has arisen because unreliable findings are presented as reliable.”
[From the Center for Open Science]
The Center for Open Science is seeking graduate students, post docs, researchers and academic faculty to participate in a survey to investigate the factors that affect the perceived credibility and use of preprints.
Participation in this study involves:
– A time commitment of up to 20 minutes.
– Survey involving your qualitative, subjective evaluation of factors related to the credibility of preprints.
Currently using preprints (either uploading preprints or reading preprints) is not a prerequisite to participating in the study.
If you are interested in enrolling in this study, please click this link which will lead you directly to the survey. You must be 18 or older to participate.
If you would like more information, please contact this project’s research lead, Courtney Soderberg, by email (courtney@cos.io).
Thank you!
[From the paper “Consistency without Inference: Instrumental Variables in Practical Application” by Alwyn Young, posted on his university webpage at London School of Economics]
“I use Monte Carlo simulations, the jackknife and multiple forms of the bootstrap to study a comprehensive sample of 1359 instrumental variables regressions in 31 papers published in the journals of the American Economic Association.”
“I maintain, throughout, the exact specification used by authors and their identifying assumption that the excluded instruments are orthogonal to the second stage residuals. When bootstrapping, jackknifing or generating artificial residuals for Monte Carlos, I draw samples in a fashion consistent with the error dependence within groups of observations and independence across observations implied by authors’ standard error calculations.”
“Non-iid errors weaken 1st stage relations, raising the relative bias of 2SLS and generating mean squared error that is larger than biased OLS in almost all published papers.”
“Monte Carlo simulations based upon published regressions show that non-iid error processes adversely affect the size and power of IV estimates, while increasing the bias of IV relative to OLS, producing a very low ratio of power to size and mean squared error that is almost always larger than biased OLS.”
“In the top third most highly leveraged papers in my sample, the ratio of power to size approaches one, i.e. 2SLS is scarcely able to distinguish between a null of zero and the alternative of the mean effects found in published tables.”
“Monte Carlos show, however, that the jackknife and (particularly) the bootstrap allow for 2SLS and OLS inference with accurate size and a much higher ratio of power to size than achieved using clustered/robust covariance estimates. Thus, while the bootstrap does not undo the increased bias of 2SLS brought on by non-iid errors, it nevertheless allows for improved inference under these circumstances.”
“I find that avoiding the finite sample 2SLS standard estimate altogether and focusing on the bootstrap resampling of the coefficient distribution alone provides the best performance, with tail rejection probabilities on IV coefficients that are very close to nominal size in iid, non-iid, low and high leverage settings.”
“In sum, whatever the biases of OLS may be, in practical application with non-iid error processes and highly leveraged regression design, the performance of 2SLS methods deteriorates so much that it is rarely able to identify parameters of interest more accurately or substantively differently than is achieved by OLS.”
[From the paper “The practical alternative to the p-value is the correctly used p-value” by Daniël Lakens, posted at PsyArXiv Preprints]
“I do not think it is useful to tell researchers what they want to know. Instead, we should teach them the possible questions they can ask (Hand, 1994). One of these questions is how surprising observed data is under the assumption of some model, to which a p-value provides an answer.”
“The accusation that p-values are a cause of the problems with replicability across scientific disciplines lacks empirical support. Hanson (1958) examined the replicability of research findings published in anthropology, psychology, and sociology. One of the hypotheses examined was whether propositions advanced with explicit confirmation criteria, such as the rejection of a hypothesis at a 5% significance level, were more replicable than propositions made without such an explicit confirmation criterium. He found that ‘over 70 per cent of the original propositions advanced with explicit confirmation criteria were later confirmed in independent tests, while less than 46 per cent of the propositions advanced without explicit confirmation criteria were later confirmed.”
“There is also no empirical evidence to support the idea that replacing hypothesis testing with estimation, or p-values with for example Bayes factors, will matter in practice. …If alternative approaches largely lead to the same decisions as a p-value when used with care, why exactly is the p-value the problem?”
“Most problems attributed to p-values are problems with the practice of null-hypothesis significance testing. Many misinterpretations of single p-values have to do with either concluding a meaningful effect is absent after a non-significant result, or misinterpreting a significant result as an important effect.”
“I personally believe substantial improvements can be made by teaching researchers how to calculate p-values for minimal-effects tests and equivalence tests. Minimal-effects tests and equivalence tests require the same understanding of statistics as null-hypothesis tests, but provide an easy way to ask different questions from your data, such as how to provide support for the absence of a meaningful effect.”
“Teaching students that testing a range prediction is just as easy as testing against an effect size of 0 has almost no cost but might solve some of the most common misunderstandings of p-values.”
[From the blog “The replication crisis is good for science” by Eric Loken, published at The Conversation]
“Science is in the midst of a crisis: A surprising fraction of published studies fail to replicate when the procedures are repeated.”
“Is this bad for science? It’s certainly uncomfortable for many scientists whose work gets undercut, and the rate of failures may currently be unacceptably high. But, as a psychologist and a statistician, I believe confronting the replication crisis is good for science as a whole.”
“Awareness about the replication crisis appears to be promoting better behavior among scientists. Today, the stakes have been raised for researchers. They know that there’s the possibility that their study might be reviewed by thousands of opinionated commenters on the internet or by a high-profile group like the Reproducibility Project.”
“Finally, the replication crisis is helping improve scientists’ intuitions about statistical inference.”
“Researchers now better understand how weak designs with high uncertainty – in combination with choosing to publish only when results are statistically significant – produce exaggerated results.”
“The breathtaking possibility that a large fraction of published research findings might just be serendipitous is exactly why people speak of the replication crisis. But it’s not really a scientific crisis, because the awareness is bringing improvements in research practice, new understandings about statistical inference and an appreciation that isolated findings must be interpreted as part of a larger pattern.”


You must be logged in to post a comment.