[From the blog “[81] Data Replicada” by Joe Simmons and Leif Nelson, posted in December at Data Colada]
“With more than mild trepidation, we are introducing a new column called Data Replicada. In this column, we will report the results of exact (or close) preregistered replications of recently published findings.”
“…why does the world need Data Replicada? Allow us to justify our existence.”
“Even though it is much easier than ever to publish exact replications, it is still extremely hard to publish exact replications. We know for a fact that many high-quality replications remain unreported. You can’t publish failures to replicate unless you convince a review team both that the failure is robust and that it is really important. And you can’t publish a successful replication, well, ever…”
“Many published replications focus on studies that were conducted a long time ago, or at least before the field became aware of the perils of p-hacking and the importance of better research practices. We will focus on trying to replicate recently published findings, so as to get a sense for whether non-obvious research published after the “renaissance” is in fact reliable.”
“…replications have not caught on in our subfield of behavioral marketing. So at least at the outset, we intend to focus our efforts on trying to replicate studies recently published in the two top behavioral marketing journals: the Journal of Consumer Research and the Journal of Marketing Research.”
“Conducting replications is a great way to learn about the messy business of scientific discovery, and we hope to communicate what we learn to you.”
“We are hoping to make Data Replicada a regular, monthly feature of Data Colada. But since it will be effortful and expensive, we only feel comfortable committing to doing it for six months or so, at which point we will re-assess.”
To read the blog, click here.
[* EiR = Econometrics in Replications, a feature of TRN that highlights useful econometrics procedures for re-analysing existing research.]
In recent years, DAGs (Directed Acyclic Graphs) have received increased attention in the medical and social sciences as a tool for determining whether causal effects can be estimated. A brief introduction can be found here. While DAGs are commonly used to guide model specification, they can also be used in the post-publication assessment of studies.
Despite widespread recognition of the dangers of drawing causal inferences from observational studies, and with general, nominal acknowledgement that “correlation does not imply causation”, it is still standard practice for researchers to discuss estimated relationships from observational studies as if they represent causal effects.
In this blog, we show how one can apply DAGs to previously published studies to assess whether implied claims of causal effects are justified. For our example, we use the Mincer earnings regression, which has appeared in hundreds, if not thousands, of economic studies. The associated wage equation relates individuals’ observed wages to a number of personal characteristics:
ln(wage) = b0 + b1 Educ + b2 Exp + b3 Black + b4 Female + error,
where ln(wage) is the natural log of wages, Educ is a measure of years of formal education, Exp is a measure of years of labor market experience, and Black and Female are dummy variables indicating an individual’s race (black) and sex.
The parameters b1 and b2 are comonly interpreted as the rate of return to education and labor market experience, respectively. The coefficients on Black and Female are commonly interpreted as measuring labor market discrimination against blacks and women.
Suppose one came across an estimated Mincer wage regression like the one above in a published study. Suppose further that the author of that study attached causal interpretations to the respective estimated parameters. One could use DAGs to determine whether those interpretations were justified.
To do that, one would first hypothesize a DAG that summarized all the common cause relationships between the variables. By way of illustration, consider the DAG in the figure below, where U is an unobserved confounder.1

In this DAG, Educ affects Wage through a direct channel, Educ -> Wage, and an indirect channel, Educ -> Exp -> Wage. The Mincerian regression specification captures the first of these channels. However, it omits the second because the inclusion of Exp in the specification blocks the indirect channel. Assuming both channels carry positive associations, the estimated rate of return to education in the Mincerian wage regression will be downwardly biased.
We can use the same DAG to assess the other estimated parameters. Consider the estimated rate of return on labor market experience. The DAG identifies both a direct causal path (Exp -> Wage) and a number of non-causal paths. Exp <- Female -> Wage is one non-causal path, as is Exp <- Educ -> Wage. Including the variables Educ and Female in the regression equation blocks these non-causal paths. As a result, the specification solely estimates the direct causal effect, and thus provides an unbiased estimate of the rate of return of labor market experience on wages.
In a similar fashion, one can show that given the DAG above, one cannot interpret the estimated values of b3 and b4 as estimates of the causal effects of labor market and sex discrimination.
DAGs also have the benefit of suggesting tests that allow one to assess the validity of a given DAG. In particular, the DAG above implies the following independences:2
1) Educ ⊥ Female
2) Exp ⊥ Black | Educ
3) Female ⊥ Black
Rejection of one or more of these would indicate that the DAG is not supported by the data.
In practice, there are likely to be many possible DAGs for a given estimated equation. If a replicating researcher can obtain the data and code for an original study, he/she could then posit a variety of DAGs that seemed appropriate given current knowledge about the subject.
For each DAG, one could determine whether the conditions exist such that the estimated specification allows for a causal interpretation of the key parameters. If so, one could then use the model implications to assess whether the DAG was “reasonable”, as evidenced by non-conflicting data.
If no DAGs can be found that support a causal interpretation, or if adequacy tests cause one to eliminate all such DAGs, one could then request that the original author provide a DAG that would support their causal interpretations. In this fashion, existing studies could be assessed to determine if there is an evidentiary basis for causal interpretation of the estimated effects.
2 A useful, free online tool for drawing and assessing DAGs, is DAGitty, which can be found here.
Bob Reed is a professor of economics at the University of Canterbury in New Zealand. He is also co-organizer of the blogsite The Replication Network. He can be contacted at bob.reed@canterbury.ac.nz.
[Excerpts taken from the article “In praise of replication studies and null results”, an editorial published in Nature]
“The Berlin Institute of Health last year launched an initiative with the words, ‘Publish your NULL results — Fight the negative publication bias! Publish your Replication Study — Fight the replication crises!”
“The institute is offering its researchers €1,000 (US$1,085) for publishing either the results of replication studies — which repeat an experiment — or a null result, in which the outcome is different from that expected.’”
“…Twitter, it seems, took more notice than the thousands of eligible scientists at the translational-research institute. The offer to pay for such studies has so far attracted only 22 applicants — all of whom received the award.”
“Replication studies are important….But publishing this work is not always a priority for researchers, funders or editors — something that must change.”
“Aside from offering cash upfront, the Berlin Institute of Health has an app and advisers to help researchers to work out which journals, preprint servers and other outlets they should be contacting to publish replication studies and data.”
“…more journals need to emphasize to the research community the benefits of publishing replications and null results.”
“At Nature, replication studies are held to the same high standards as all our published papers. We welcome the submission of studies that provide insights into previously published results; those that can move a field forwards and those that might provide evidence of a transformative advance.”
“Not all null results and replications are equally important or informative, but, as a whole, they are undervalued. If researchers assume that replications or null results will be dismissed, then it is our role as journals to show that this is not the case. At the same time, more institutions and funders must step up and support replications — for example, by explicitly making them part of evaluation criteria.”
“We can all do more. Change cannot come soon enough.”
To read the article, click here.
[Excerpts taken from the RFP “Data Enhancement of the DARPA SCORE Claims Dataset” posted at the Center for Open Science website]
“The DARPA SCORE Dataset contains claims from about 3,000 empirical papers published between 2009 and 2018 in approximately 60 journals in the social and behavioral sciences.”
“We seek proposals from research teams to enhance the Dataset with information about the papers that may be relevant to assessing the credibility of the coded claims. Such enhancements could include information such as:”
– “Extraction of statistical variables or reporting errors in the original papers.”
– “Identification of the public availability of data, materials, code, or preregistrations associated with the studies reported in the papers.”
– “Citations or other altmetrics associated with the papers.”
– “Identification of replications or meta-analytic results of findings associated with the paper or claims.”
– “Indicators of credibility, productivity, or other features of the authors of the papers.”
– “Extraction of design features, reporting styles, quality indicators, or language use from the original papers.”
“Possible data enhancements for the Database are not limited to these examples.”
“The key criteria for proposed data enhancements are:”
– “Relevance of the proposed variable additions to assessment of credibility of the papers and claims.”
– “Potential applicability of credibility/validity variable additions to other/broader targets or levels of abstraction besides claims or papers. For example, averaging or aggregation of claim or paper-level scores to generate “average”/expected credibility of authors, journals, or sub-disciplines.”
– “The proportion of papers that are likely to benefit from the data enhancement (i.e., minimization of missing data).”
– “The extent to which the data enhancement is automated.”
– “Evidence that extraction or identification of new data is valid, reliable, and easy to integrate with the Dataset.”
– “Description of data quality control practices that will be employed in proposed data-generation activity (e.g., interrater agreement tests, data sample auditing/revision processes).”
– “Cost for conducting the work.”
– “Completing the proposed work by June 30, 2020.”
“A total of $100,000 is available for data enhancement awards and we expect to make 4 to 15 total awards. Proposals should be no more than 2 pages and address the selection criteria above.”
[Excerpts taken from the article “New Measure Rates Quality of Research Journals’ Policies to Promote Transparency and Reproducibility”, published by the Center for Open Science at their website.]
“Today, the Center for Open Science launches TOP Factor, an alternative to journal impact factor (JIF) to evaluate qualities of journals. TOP Factor assesses journal policies for the degree to which they promote core scholarly norms of transparency and reproducibility.”
“TOP Factor is based primarily on the Transparency and Openness Promotion (TOP) Guidelines, a framework of eight standards that summarize behaviors that can improve transparency and reproducibility of research such as transparency of data, materials, code, and research design, preregistration, and replication.”
“Journals can adopt policies for each of the eight standards that have increasing levels of stringency. For example, for the data transparency standard, a score of 0 indicates that the journal policy fails to meet the standard, 1 indicates that the policy requires that authors disclose whether data are publicly accessible, 2 indicates that the policy requires authors to make data publicly accessible unless it qualifies for an exception (e.g., sensitive health data, proprietary data), and 3 indicates that the policy includes both a requirement and a verification process for the data’s correspondence with the findings reported in the paper.”
“TOP Factor also includes indicators of whether journals offer Registered Reports, a publishing model that reduces publication bias of ignoring negative and null results, and badging to acknowledge open research practices to facilitate visibility of open behaviors.”
“At the TOP Factor website, users can filter TOP Factor scores by discipline, publisher, or by subsets of the standards to see how journal policies compare.”
“‘Disciplines are evolving in different ways toward improving rigor and transparency,’ noted Brian Nosek, Executive Director of the Center for Open Science. ‘TOP Factor makes that diversity visible and comparable across research communities. For example, economics journals are at the leading edge of requiring transparency of data and code whereas psychology journals are among the most assertive for promoting preregistration.’”
“So far, over 250 journal policies have been evaluated and are presented on the TOP Factor website. …Journals will be added continuously over time.”
“Editors and community members can complete a journal evaluation form on the TOP Factor website to accelerate the process. Center for Open Science staff review those submissions and confirm with the journal’s publicly posted policies before posting the scores to the TOP Factor website.”
To read the article and access TOP Factor, click here.
[Excerpts taken from the preprint, “An excess of positive results: Comparing the standard Psychology literature with Registered Reports” by Anne Scheel, Mitchell Schijen, and Daniël Lakens, posted at PsyArXiv]
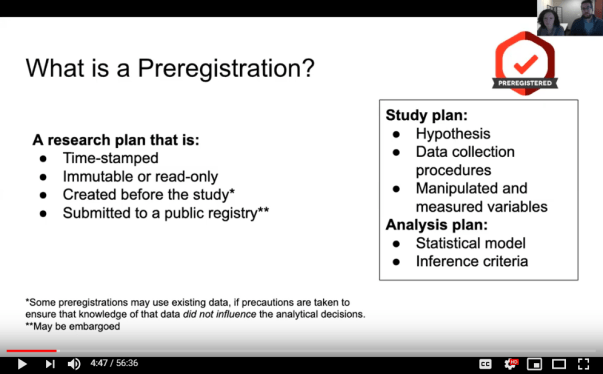
“Registered Reports (RRs) are a new publication format…Before collecting data, authors submit a study protocol containing their hypotheses, planned procedures, and analysis pipeline…to a journal. The protocol undergoes peer review, and, if successful, receives ‘in-principle acceptance’, meaning that the journal commits to publishing the final article following data collection, regardless of the statistical significance of the results.”
“The authors then collect and analyse the data and complete the final report. The final report undergoes another round of peer review, but this time only to ensure that the authors adhered to the registered plan and did not draw unjustified conclusions…”
“Registered Reports thus combine an antidote to QRPs (preregistration) with an antidote to publication bias, because studies are selected for publication before their results are known.”
“The goal of our study was to test if Registered Reports in Psychology show a lower positive result rate than articles published in the traditional way (henceforth referred to as ‘standard reports’, SRs), and to estimate the size of this potential difference.”
“For standard reports we downloaded a current version of the Essential Science Indicators (ESI) database…and used Web of Science to search for articles published between 2013 and 2018 with a Boolean search query containing the phrase ‘test* the hypothes*’ and the ISSNs of all 633 journals listed in the ESI Psychiatry /Psychology category. Using the same sample size as Fanelli (2010), we randomly selected 150 papers…”
“For Registered Reports we aimed to include all published Registered Reports in the field of Psychology that tested at least one hypothesis, regardless of whether or not they used the phrase ‘test* the hypothes*’. We downloaded a database of published Registered Reports curated by the Center for Open Science…and excluded papers published in journals that were listed in categories other than ‘Psychiatry/Psychology’ or ‘Multidisciplinary’ in the ESI.”
“Of the 151 entries in the COS Registered Reports database, 55 were excluded because they belonged to a non-Psychology discipline, 12 because we could not verify that they were Registered Reports, and 13 because they did not test hypotheses or contained insuffcient information, leaving 71 Registered Reports for the final analysis.”
“146 out of 152 standard reports and 31 out of 71 Registered Reports had positive results…see Fig. 2…this difference…was statistically significant…p < .001.”
“We thus accept our hypothesis that the positive result rate in Registered Reports is lower than in standard reports.”

“To explain the 52.39% gap between standard reports and Registered Reports, we must assume some combination of differences in bias, statistical power, or the proportion of true hypotheses researchers choose to examine.”
“Figure 3 visualises the combinations of statistical power and proportion of true hypotheses that would produce the observed positive result rates if the literature were completely unbiased.”
“For example, assuming no publication bias and no QRPs, even if all hypotheses authors of standard reports tested were true, their study designs would need to have more than 90% power for the true effect size. This is highly unlikely, meaning that the standard literature is unlikely to reflect reality.”

“It is a-priori plausible that Registered Reports are currently used for a population of hypotheses that are less likely to be true: For example, authors may use the format strategically for studies they expect to yield negative results (which would be difficult to publish otherwise).”
“However, assuming over 90% true hypotheses in the standard literature is neither realistic, nor would it be desirable for a science that wants to advance knowledge beyond trivial facts. We thus believe that this factor alone is not sufficient to explain the gap between the positive result rates in Registered Reports and standard reports. Rather, the numbers strongly suggest a reduction of publication bias and/or Type-1 error inflation in the Registered Reports literature.”
To read the article, click here.
[Excerpts taken from the article “A miracle cancer prevention and treatment? Not necessarily as the analysis of 26 articles by legendary Hans Eysenck shows” by Tomasz Witkowski and Maciej Zatonski, published in Science Based Medicine]
“In May 2019 a report from an internal enquiry conducted by the King’s College London (KCL) was released. This report diplomatically labels 26 articles published by Professor Hans Jürgen Eysenck as “unsafe”…”
“The report published by the KCL committee scrutinised only articles from peer-reviewed journals that Eysenck co-authored with Ronald Grossarth-Maticek, and analysed data relevant to personality and physical health outcomes in conditions like cancer, cardiovascular diseases, their causes and methods of treatment. All of reviewed research results were assessed as ‘unsafe’.”
“In their publications both authors claimed no causal connection between tobacco smoking and development of cancer or coronary heart disease, and attributed those outcomes to personality factors…”
“In one of their research projects conducted among more than 3,000 people, Eysneck and Grossarth-Maticek have claimed that people with a “cancer-prone personality” were 121 times more likely to die of the disease than patients without such a disposition (38.5% vs 0.3% ).”
“The authors have also contributed personality factors to the risk of developing coronary heart disease. Their publications stated that subjects who were “heart-disease prone” died 27 times more often than people without such temperament.”
“The greatest hits in the album of suspicious publications are articles where the authors “demonstrated” that they can effectively “prevent cancer and coronary heart disease in disease-prone probands”. In one of their projects, 600 “disease-prone probands” received a leaflet explaining how to make more autonomous decisions and how to take control over their destinies.”
“This simple intervention resulted in one of the most spectacular findings in the history of medicine, psychology, and probably in the entire scientific literature. After over 13 years of observation, the group of 600 patients randomly assigned to this “bibliotherapy” (as it was called by the authors) had an overall mortality of 32% when compared to 82% among the 600 people who were not lucky enough to receive the leaflets.”
“However, the most destructive and infamous of his achievements was the publication of the book entitled The Causes and Effects of Smoking in 1980, where he condemned the already established causal relationship between tobacco smoking and lung cancer. His later cooperation with Ronald Grossarth-Maticek resulted in the publication of numerous articles that were recently assessed as “unsafe”. The irregularities uncovered during preparation of the KCL’s report appalled and shocked the global scientific community.”
“After humiliating degradation and after losing his job Diedrik Stapel published a particular memoir of a fraudster, where he described a rather accurate characteristics of the academia of psychologists. He emphasises virtually complete lack of any structure of control or self-correction: ‘Nobody ever checked my work. They trusted me.’”
“…the price for such misperceived and ill-understood academic freedom will be paid by members of the general public when they make everyday decisions related to smoking or when deciding to improve on their personalities, fed by misconstrued beliefs related to the development of cancer, unnecessary suffering, and premature deaths. Those damages will never be assessed.”
To read the article, click here.
Category: NEWS & EVENTS
Tags: cancer, Cardiovascular disease, Diedrik Stapel, Hans Jürgen Eysenck, King's College London, Lung cancer, Personality factors, Psycho-oncology, Psychology, Scientific fraud, Tobacco smoking
[Excerpts taken from the article “Trouble replicating cancer studies a ‘wake-up call’ for science” by Jack Groves, published at timeshighereducation.com]
“Later this year, the Virginia-based Center for Open Science will publish the final two papers of an initiative launched in 2013 with the aim of replicating experiments from 50 high-impact cancer biology papers.”
“Many replication efforts were dropped, however, as the organisers realised that they needed more information from the original authors because vital methodological instructions had not been included in published papers. Frequently such details – as well as required materials – proved difficult to obtain, often owing to a lack of cooperation from the laboratories.”
“Subsequent delays and cost increases meant that just 18 papers covering 52 separate experiments, out of an initial 192 experiments targeted, were eventually replicated.”
“The forthcoming papers in the replication study – one detailing the results of all 18 replicated papers, one on why so few were completed – were likely to be a “wake-up call” to science “given that so much information is missing” from published papers, according to Brian Nosek, the centre’s director and co-founder, who is also professor of psychology at the University of Virginia.”
To read the article, click here.
[Excerpts taken from the article “The 2019 BITSS Annual Meeting: A barometer for the evolving open science movement” by Aleksandar Bogdanoski and Katie Hoeberling, posted at bitss.org]
“Each year we look forward to our Annual Meeting as a space for showcasing new meta-research and discussing progress in the movement for research transparency.”
“…we’ve historically focused our efforts on research conduct, rather than on publishing. It’s become abundantly clear in recent years, however, that access is a critical component in the production and evaluation of social science.”
“Acknowledging this, we’ve forged fruitful partnerships with stakeholders on the “other end” of the scholarly communication cycle, including the Journal of Development Economics and the Open Science Framework Preprints platform.”
“Wide access to training resources is similarly critical for normalizing open research practices. Open Science (with a capital O and S) has only recently entered the social science curriculum.”
“Speakers on the meeting’s final panel discussed the challenges they’ve faced in trying to institutionalize open science curriculum and supporting their students in applying open principles outside of the classroom, as well as approaches and resources they’ve found helpful.”
“Instructors and students looking to teach or learn transparent research practices can start at our Resource Library or this growing list of course syllabi on the OSF.”
“Having organized eight of these annual events, a few other patterns have begun to emerge. One of the most exciting developments we’ve seen is that our meetings have shifted focus from diagnosing problems in research, to testing interventions and assessing adoption and wider change.”
“There is no longer a need, at least in this community, to debate whether or not publication bias exists or that perverse incentives lead researchers to use questionable research practices, for example. How we measure and correct for them, however, remain open questions. Such questions were discussed during the first block of research presentations, which proposed sensitivity analysis in meta-analysis and revised significance thresholds compatible with researcher behavior to correct for publication bias, plus a framework to translate open practices for observational research.”
“Relatedly, the use of pre-registration and pre-analysis plans (PAPs) is becoming more normative than cutting edge.”
“Finally, it’s become clear that the reach and efficacy of many open science tools can benefit from, and often requires, the support of diverse stakeholders, as well as rigorous evaluation components integrated in interventions from the beginning. The final block of presentations explored the application of open science principles in novel contexts, including Institutional Review Boards and qualitative research with sensitive data, and offered a general framework for designing and evaluating open science interventions.”
“If you missed the meeting, or want to revisit any of the sessions, you can find slides on this OSF page, watch videos on our YouTube channel, and find open access versions of the papers in the event agenda. The summaries of each session can be found below…” [go to link below].
To read the article, click here.




You must be logged in to post a comment.