Microfinance is one of the most hotly debated interventions in developing countries over the last 20 years. These are generally small loans, often given to women with short repayment periods and high interest rates (though often much lower than local market rates).
Proponents argue that the poor often are severely cash constrained and a little bit of money can help them to realize their economic potential. Researchers and policy makers have been worried about people being caught in debt traps, making their poverty worse. Prior to the rise of randomized control trials (RCTs) in economics the evidence either way was mostly anecdotal.
Then some experimental evidence started to emerge, and the results were not encouraging. Karlan and Zinman (2011) and then six other RCT studies published in a 2015 special issue of the American Economic Journal: Applied Economics found no statistically significant economic impacts from giving people small loans. In Fiala (2018) I found some positive short-run impacts, but only for men.
However, not all evidence, even experimental, is created equal. In Dahal and Fiala (2020) we closely re-analyze these eight papers to examine just how well these studies were designed to answer the questions they wanted to answer. We find that the lack of statistical significance is likely not due to a lack of impacts. Rather, the problem is that these studies are extremely underpowered. I
ndividual coefficients are actually quite large, but the standard errors are even bigger. Ex-post power calculations for each of the studies show the minimum detectable effect (MDE) size for main outcomes is up to 1,000%. Median (mean) MDE is 132% (201%). The authors find effects closer to 30%, a large impact but far from what is needed to be statistically significant.
Why are these studies so underpowered? One of the biggest reasons is that there is significant non-compliance. Take-up rates of loans in the treatment groups is generally low. Often the difference between take-up of loans between treatment and control groups is tiny. Three of the American Economic Journal: Applied Economics papers have net compliance rates less than 10 percentage points, making reasonable inference almost impossible.
While some of the authors of the original studies acknowledge potential issues of low power, they never quantify them. This lack of transparency has led many people, including the original authors, to describe the null results as precisely estimated.
Our analysis opens up a bigger problem within experimental methods in general: RCTs can be the gold standard of inference, but only when designed and implemented properly on questions they can be used to answer.
The problems of design in microfinance isn’t due to low quality researchers running poor quality studies. Two of the recent Noble Prize winners in Economics are authors of these studies, and one of them was the editor of the American Economic Journal: Applied Economics when these studies were published. One of the papers had been a working paper for years. Even looking back at the standards of 2015, none of these studies passed what was considered appropriate quality.
Although these papers do not show a “transformative” impact of microfinance on the lives of poor households, careful reading of the papers reveals that they also do not discredit the role of microcredit in poverty alleviation and improving livelihoods of poor households.
The main conclusion of Dahal and Fiala (2020) is that we actually have no idea about the impact of microfinance on the lives of poor people because there is not a single study looking at the impact of the traditional microfinance model that is designed well enough to answer this question.
Nathan Fiala is an assistant professor at the University of Connecticut, honorary senior lecturer at Makerere University in Uganda, and a research fellow at RWI in Essen, Germany. He can be contacted at nathan.fiala@uconn.edu.
[Excerpts taken from the article “Comparing meta-analyses and preregistered multiple-laboratory replication projects” by Amanda Kvarven, Eirik Strømland, and Magnus Johannesson, published in Nature Human Behaviour]
“In the past 30 years, the number of meta-analyses published across scientific fields has been growing exponentially and some scholars have called for greater reliance on ‘meta-analytic thinking’ in the behavioural sciences.”
“However, the properties of a meta-analysis depend on the primary studies that it includes; if primary studies overestimate effect sizes in the same direction, so too will the meta-analysis.”
“Our approach is to use large-scale registered replication studies in psychology carried out at multiple laboratories…as a baseline to which the results of meta-analyses on the same topics will be compared.”
“We started by collecting data on studies in psychology where many different laboratories joined forces to replicate a well-known effect according to a pre-analysis plan.”
“After identification of relevant replication experiments, we searched for meta-analyses on the same research question.”
“…our final dataset spans 15 preregistered replication studies using a multiple-laboratory format…and 15 corresponding meta-analyses on the same research question…”
“We compared the meta-analytic to the replication effect size for each effect using a z-test.”
“All our statistical tests are two-tailed and follow the recent recommendation to refer to tests with P < 0.005 as statistically significant and P = 0.05 as suggestive evidence against the null.”
“As seen in Fig. 2a, the meta-analysis and replication studies reach the same conclusion about the direction of the effect using the 0.005 statistical significance criterion for seven (47%) study pairs…”
“For seven (47%) study pairs, the meta-analysis finds a significant effect in the original direction whereas the replication cannot reject the null hypothesis…”
“…in the remaining study pair, the meta-analysis cannot reject the null hypothesis whereas the replication study finds a significant effect in the opposite direction to the original study.”

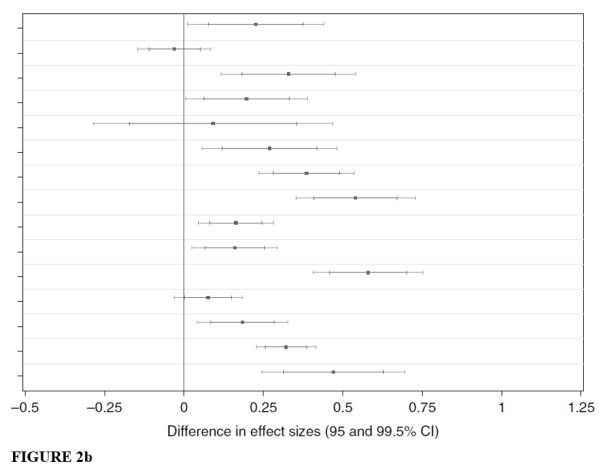
“In Fig. 2b we can see that the difference in estimated effect size is significant for 12 (80%) of the studies, and there is suggestive evidence of a difference for one additional study. For all 12 studies, the effect size is higher in the meta-analysis.”
“A central caveat in interpreting our findings is the potential impact of heterogeneity in the meta-analyses in our sample.”
“We find no evidence of our findings being explained by heterogeneity in meta-analysis and replicator selection but, at the same time, we cannot rule out that replicator selection has affected our results. Our results should therefore be interpreted cautiously, and further work on heterogeneity and replicator selection is important.”
“In a previous related study in the field of medicine, 12 large randomized, controlled trials published in four leading medical journals were compared to 19 meta-analyses published previously on the same topics.”
“They did not provide any results for the pooled overall difference between meta-analyses and large clinical trials, but from graphical inspection of the results there does not appear to be a sizeable systematic difference.”
“This difference in results between psychology and medicine could reflect a genuine difference between those fields, but it could also reflect the fact that even large clinical trials in medicine are subject to selective reporting or publication bias.”
“An important difference between medicine and psychology is also the requirement of the former to register randomized controlled trials, which may diminish the biases of published studies; no such requirement exists in psychology.”
“A potentially effective policy for reducing publication bias and selective reporting is preregistration of analysis plans before data collection, an increasing trend in psychology. This has the potential to increase the credibility of both the original studies and meta-analyses, rendering the latter a more valuable tool for aggregation of research results.”
To read the article, click here (NOTE: Article is behind a paywall).
Every week for 9 weeks you can hear leaders in research transparency talk about their latest thinking on how to make statistical research open, reproducible, and credible. To learn more, see the schedule below and click on each speaker to learn details.
The webcasts are sponsored by Project TIER and will be streamed every Friday at 1:00 pm (Eastern Standard Time, USA), from February 7 through April 3.
Registration is free, but you need to register to access the live stream.
More information and a link to registration can be found here.
SCHEDULE:
|
2/7/20
|
|
To Be Announced
|
2/14/20
|
|
Statistically Valid Inferences from Privacy Protected Data
|
2/21/20
|
|
Checking Robustness in 4 Steps
|
2/28/20
|
|
Falsifying Predictions in Practice
|
3/6/20
|
|
A Computing Workflow for Reproducible Results
|
3/13/20
|
|
Why Scientific Reasoning is Hard: The Role of Cognitive Constraints in Biasing Our Reasoning
|
3/20/20
|
|
Replication and Reproducibility in Social Sciences and Statistics: Context, Concerns, and Concrete Measures
|
3/27/20
|
|
The Importance of Reproducibility in High-Throughput Biology: Case Studies in Forensic Bioinformatics
|
4/3/20
|
|
Promoting Research and Transparency and Reproducibility Through Capacity-Building Trainings Across Sub Saharan Africa and Europe: Lessons Learned and Way Forward.
|
Replication is important. Many journals in economics, including Energy Economics, now insist on papers being published together with a replication package, and a few journals check that package prior to publication. This is a world apart from the common practice only a decade ago. However, the step change in replicability did not lead to a step change in replication.
Energy Economics has therefore published a special issue on replication. We particularly invited replication of older but prominent research, that is, papers that are frequently cited or used in policy making. This type of paper asks whether the old results stand up if newer data are added and methods are brought up to date, and if not why.
We also invited encompassing papers, taking a number of recent articles to check whether the results still hold if all the evidence is put together, comparing results across methods and data sets. No such papers were submitted to the special issue. Energy Economics now has “replication paper” as a new type of submission.
Fifty-seven papers were submitted to the special issue, of which twenty-four were accepted. One author of a replicated paper submitted a comment. Most rejections were because the paper did not add much beyond a replication. The referees, unfamiliar with replication papers, to a person drew a clear distinction between a replication paper that confirms the technical competence of the original authors and a replication paper that adds value.
Six of the twenty-three replications were unsuccessful. The relatively high success rate may be because energy economics is a mature field, and a modest one were few people chase headlines.
Two papers stand out. Jeffrey Racine’s paper reviews software tools that integrate data, analysis, and writing, so as to minimize errors and ensure internal consistency. Bruns and Koenig wrote a pre-replication plan and invited the author of the replicated paper, Stern, to join in the replication. In the resulting paper, they emphasize the importance of the pre-analysis plan to maximise objectivity and minimize conflict.
The special issue demonstrates that there is a supply of replication papers. Serious scholars are prepared to make the time and effort to take a piece of previous research, check whether it withstands scrutiny, and report their findings in a constructive and respectful manner. The special issue also shows that referees are able to tell quality and worthwhile replications from ones that are less so. It is too early to say whether these replication papers are cited and count towards promotion. Finally, the special issue reveals that publishers too can be moved towards replication.
To check out the special issue on replication at Energy Economics, click here.
Richard Tol is a professor of economics at the University of Sussex and professor of the economics of climate change at the Vrije Universiteit Amsterdam. He is Editor-in-Chief at Energy Economics.
[Excerpts taken from the article, “Blocking the Hype‐Hypocrisy‐Falsification‐Fakery Pathway is Needed to Safeguard Science”, by Henning Hopf, Stephen Matlin, Goverdhan Mehta, and Alain Krief, published in Angewandte Chemie International Edition]
“Hype has become prevalent in the age of instantaneous mass communication…there are several drivers.”
“One has been the increasing pressure on academic scientists to demonstrate the “quality”, “value” and “impact” of their work…through metrics that focus on the mechanical surveying of statistics related to the number of publications, their rates of citation and the “impact factors” of the journals in which they are published.”
“To understand how seriously misguided this approach is, one needs to look no further than the cases of Peter Higgs (Nobel Laureate 2013 for the theoretical discovery of the Higgs Boson), who would not have had a scientific career if his publication rate had been taken into account…”
“This pressure was building throughout the 20th century as science expanded, became better funded and increasingly competitive at all levels.”
“It was boosted by the advent of the digital age and by the growing influence of commercial publishers, with intensifying competition among commercial and learned society publishers for a share of the lucrative, expanding market for science journals.”
“Further pressure came from increasing competition between academic centres to enhance their reputations and income by efforts to recruit and retain leading scientists.”
“…the intersection of the science advancement system (via publications), the career reward system (status, promotions, grants and prizes) and the financial system (large profits from publishing journals) has created perverse incentives for authors, publishers…and institutions to game the publishing system to their own advantage.”
“Academic institutions have added to the hype generated between authors and journals by establishing and expanding press and “development” offices that seek to attract attention in the popular media by producing press releases, e-newsletters and website pages summarising the research and its significance…”
“It is but another step down from the grey hinterland of hype into the dark underworld of deliberate falsification.”
“Journals, scientists, institutions and funders all have a part in tackling reproducibility.”
“Many institutions have acceded (at least on paper) to the Declaration on Research Assessment (DORA),…while continuing to turn a blind eye to committees that persist in giving weight to publication metrics such as h-indices and impact factors in assessing academics for employment or promotion.”
“Leading national academies…and individual scientists… have recommended good practices in the evaluation of researchers and research programmes, emphasising the importance of assessment by competent experts rather than reliance on publication metrics.”
“The worlds of science publication, career rewards and commercial interests are tightly interconnected.”
“Finding solutions that will discourage, detect and penalise those who travel along the hype-hypocrisy-falsification-fakery pathway must therefore involve systemic approaches that consider how changes in one part of the system will impact on other parts.”
To read the article, click here.
[Excerpts taken from the article “Ten UK universities create reproducibility-focused senior roles” by Simon Baker, published in Times Higher Education]
“The involvement of 10 universities that have officially joined a UK network set up to tackle the issue of reproducibility in research will be “critical” in making an impact, one of its leaders has said.”
“Institutions including UCL and the universities of Edinburgh, Bristol and Sheffield have signed up to be part of the UK Reproducibility Network, which was established last year in a bid to better coordinate efforts to boost the robustness of research.”
“Each university has created a role that will feature a senior academic leading on practical steps the institution is taking to bolster research quality, such as better training, open data practices and assessing the criteria used in recruitment and promotion decisions.”
“Marcus Munafò, chair of the network and professor of biological psychology at the University of Bristol, told Times Higher Education that the official involvement of universities provided a vital “middle” layer between funders and academics in the drive to tackle the issue.”
“Having institutions on board would also allow them to develop a consistent approach towards policies that can shift research culture away from practices that hamper reproducibility and transparency, Professor Munafò said.”
To read the article, click here.
[Excerpts taken from the article “A consensus-based transparency checklist” by Balazs Aczel and many, many others, published in Nature Human Behavior]
“Ideally, science is characterized by a ‘show me’ norm, meaning that claims should be based on observations that are reported transparently…”
“How can scientists increase the transparency of their work?”
“We provide a consensus-based, comprehensive transparency checklist that behavioural and social science researchers can use to improve and document the transparency of their research…”
“Responses to the checklist items can be submitted along with a manuscript, providing reviewers, editors and, eventually, readers with critical information about the research process necessary to evaluate the robustness of a finding.”
“The initial set of items was evaluated by 45 behavioural and social science journal editors-in-chief and associate editors, as well as 18 open-science advocates.”
“The Transparency Checklist was iteratively modified by deleting, adding and rewording the items until a sufficiently high level of acceptability and consensus were reached and no strong counter arguments for single items were made…”
“The final version of the Transparency Checklist 1.0 contains 36 items that cover four components of a study: preregistration; methods; results and discussion; and data, code and materials availability. For each item, authors select the appropriate answer from prespecified options.”
“It is important to emphasize that none of the responses on the checklist is a priori good or bad and that the transparency report provides researchers the opportunity to explain their choices at the end of each section.”
“In addition to the full checklist, we provide a shortened 12-item version (Fig. 1). By reducing the demands on researchers’ time to a minimum, the shortened list may facilitate broader adoption, especially among journals that intend to promote transparency but are reluctant to ask authors to complete a 36-item list.”
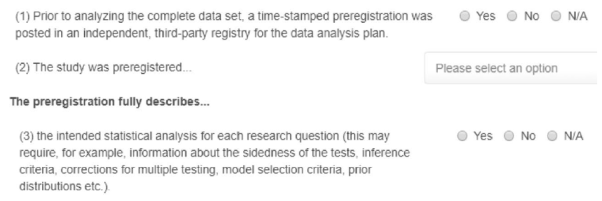

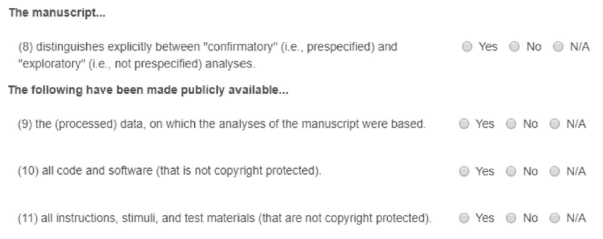

“We created online applications for the two checklists that allow users to complete the form and generate a report that they can submit with their manuscript and/or post to a public repository…”
“The checklist is subject to continual improvement, and we encourage researchers, funding agencies and journals to provide feedback and recommendations.”
To read the article, click here.
[Excerpts taken from the article “Crowdsourcing hypothesis tests: Making transparent how design choices shape research results” by Justin Landy and many others, posted at the preprint repository at the University of Essex]
“…we introduce a crowdsourced approach to hypothesis testing. In the crowdsourcing initiative reported here, up to 13 research teams (out of a total of 15 teams) independently created stimuli to address the same five research questions, while fully blind to one another’s approaches, and to the original methods and the direction of the original results.”
“The original hypotheses, which were all unpublished at the time the project began, dealt with topics including moral judgment, negotiations, and implicit cognition.”
“Rather than varying features of the same basic design…we had different researchers design distinct studies to test the same research questions…”
“The five research questions were gathered by emailing colleagues conducting research in the area of moral judgment and asking if they had initial evidence for an effect that they would like to volunteer for crowdsourced testing by other research groups.”
“We identified five directional hypotheses in the areas of moral judgment, negotiation, and implicit cognition, each of which had been supported by one then unpublished study.”
“A subset of the project coordinators…recruited 15 teams of researchers through their professional networks to independently design materials to test each hypothesis.”
“…materials designers were provided with the nondirectional versions of the five hypotheses presented in Table 1, and developed materials to test each hypothesis independently of the other teams.”

“…our primary focus is on dispersion in effect sizes across different study designs.”
“The diversity in effect size estimates from different study designs created to test the same theoretical ideas constitute the primary output of this project. For Hypotheses 1-4, the effect sizes were independent-groups Cohen’s ds, and for Hypothesis 5, they were Pearson rs.”
“Effect size estimates…were calculated… using…random-effects meta-analyses…This model treats each observed effect size yi as a function of the average true effect size μ, between-study variability, ui ∼ N(0, τ2), and sampling error, ei ∼ N(0, vi)…yi = μ + ui + ei.”
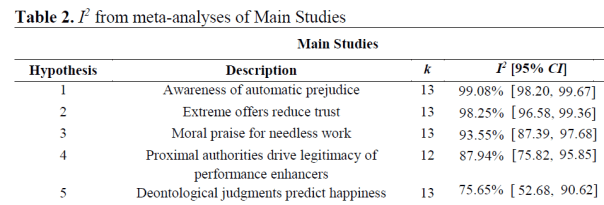
“The I2 statistic quantifies the percentage of variance among effect sizes attributable to heterogeneity, rather than sampling variance. By convention, I2 values of 25%, 50%, and 75% indicate low, moderate, and high levels of unexplained heterogeneity, respectively.”
“All five hypotheses showed statistically significant and high levels of heterogeneity… The vast majority of observed variance across effect sizes in both studies is unexplained heterogeneity.”
Discussion
“How contingent is support for scientific hypotheses on the subjective choices that researchers make when designing studies?… In this crowdsourced project, when up to 13 independent research teams designed their own studies to test five original research questions, variability in observed effect sizes proved dramatic…”
“…different research teams designed studies that returned statistically significant effects in opposing directions for the same research question for four out of five hypotheses in the Main Studies…”
“Even the most consistently supported original hypotheses still exhibited a wide range of effect sizes, with the smallest range being d = -0.37 to d = 0.26…”
“…a number of aspects of our approach may have led to artificial homogeneity in study designs.”
“In particular, materials designers were restricted to creating simple experiments with a self-reported dependent measure that could be run online in five minutes or less.”
“Further, the key statistical test of the hypothesis had to be a simple comparison between two conditions (for Hypotheses 1-4), or a Pearson correlation (for Hypothesis 5).”
“Full thirty-minute- to hour-long-laboratory paradigms with factorial designs, research confederates, and more complex manipulations and outcome measures (e.g., behavioral measures) contain far more researcher choice points and may be associated with even greater heterogeneity in research results…”
“…one cannot generalize the present results to all hypotheses in all subfields…further initiatives to crowdsource hypothesis tests are needed before drawing definitive conclusions about the impact of subjective researcher choices on empirical outcomes.”
To read the article, click here.
[Excerpts taken from the article, “We’re All ‘P-Hacking’ Now” by Christie Aschwanden, publised in Wired]
“It’s got an entry in the Urban Dictionary, been discussed on Last Week Tonight with John Oliver, scored a wink from Cards Against Humanity, and now it’s been featured in a clue on the TV game show Jeopardy. Metascience nerds rejoice! The term p-hacking has gone mainstream.”
“Journals generally prefer to publish statistically significant results, so scientists have incentives to select ways of parsing and analyzing their data that produce a p-value under 0.05. That’s p-hacking.”
“Psychologists Uri Simonsohn, Joseph Simmons, and Leif Nelson elegantly demonstrated the problem in what is now a classic paper. “False-Positive Psychology,” published in 2011, used well-accepted methods in the field to show that the act of listening to the Beatles song “When I’m Sixty-Four” could take a year and a half off someone’s age.”
“It all started over dinner at a conference where a group of researchers was discussing some findings they found difficult to believe. Afterward, Simonsohn, Simmons, and Nelson decided to see how easy it would be to reverse-engineer an impossible result with a p-value of less than 0.05. “We started brainstorming—if we wanted to show an effect that isn’t true, how would you run a study to get that result without faking anything?” Simonsohn told me.”
“They produced their absurd conclusion by exploiting what they called “researcher degrees of freedom”: the little decisions that scientists make as they’re designing a study and collecting and analyzing data.”
“The problem, as the Beatles song experiment showed, is that this kind of fiddling around allows researchers to manipulate their study conditions until they get the answer that they want…”
“A year later, the team went public with its new and better name for this phenomenon. At a psychology conference in 2012, Simonsohn gave a talk in which he used the term p-hacking for the first time.”
“’We needed a shorter word to describe [this set of behaviors], and p-dash-something seemed to make sense,’ Simmons says. ‘P-hacking was definitely a better term than ‘researcher degrees of freedom’ because you could use it as a noun or an adjective.'”
“The phrase made its formal debut in a paper the team published in 2014, where they wrote ‘p-hacking can allow researchers to get most studies to reveal significant relationships between truly unrelated variables.'”
As a wider conversation about reproducibility spread through the field of psychology, rival ways of describing p-hacking and related issues gained attention too. Columbia University statistician Andrew Gelman had used the term “the garden of forking paths” to describe the array of choices that researchers can select from when they’re embarking on a study analysis.”
“‘People say p-hacking and it sounds like someone’s cheating,” Gelman says. “The flip side is that people know they didn’t cheat, so they don’t think they did anything wrong…'”
“Simmons is sympathetic to this criticism. “We probably didn’t think enough about the connotations of the word ‘hacking,’ which implies intentions,” he says. ‘It sounds worse than we wanted it to.'”
“Still, there’s something indisputably appealing about the term p-hacking. “You can’t say that someone got their data and garden-of-forking-pathed it,” Nelson adds. ‘We wanted to make it into a single action term.'”
“The fact that p-hacking has now spread out of science and into pop culture could indicate a watershed moment in the public understanding of science, and a growing awareness that studies can’t always be taken at face value. But it’s hard to know exactly how the term is being understood at large.”
“In a perfect world, the wider public would understand that p-hacking refers not to some lousy tendency or lazy habit particular to researchers, but one that’s present everywhere. We all p-hack, to some extent, every time we set out to understand the evidence in the world around us. If there’s a takeaway here, it’s that science is hard—and sometimes our human foibles make it even harder.”
To read the article, click here.
[Excerpts taken from the article, “The Value of Preregistration for Psychological Science: A Conceptual Analysis”, by Daniël Lakens, posted at PsyArXiv Preprints]
“With the rise of the internet it has become feasible to create online registries that ask researchers to specify their research design, data collection, and the planned analyses…it is useful to evaluate whether and when it is worth preregistering your study.”
“It is…important to justify the value of preregistration based on a philosophy of science. Discussing preregistration without discussing philosophy of science is a waste of time.”
“Preregistration has the goal to allow others to transparently evaluate the capacity of a test to falsify a prediction.”
“Researchers can have many goals that are unrelated to tests of predictions, and in those cases, preregistration might have positive externalities, but it does not serve a goal that can’t be achieved through other means.”
“Mayo (1996) carefully develops arguments for the role that prediction plays in science and arrives at an error statistical philosophy based on a severity requirement: We build a body of knowledge based on claims that have passed a severe test.”
“A test is severe when it is highly capable of demonstrating a claim is false. If a researcher randomly assigns participants to a control and experimental condition, uses a response scale from 1 to 7 to measure how people feel, and claims the difference between the groups will be at most 6 scale points, there is no way for this claim to be proven false. The observed difference must be between zero and six.”
“Figure 1A visualizes a null hypothesis test, where only one specific state of the world (namely an effect of exactly zero) will falsify our prediction.”
“Figure 1B represents a one-sided null-hypothesis test, where differences larger than zero are predicted, and the prediction is falsified when the difference is either equal to zero, or smaller than zero.”
“Figure 1C visualized a range prediction where only differences between 0.5 and 2.5 support the prediction. Since there are many more ways this prediction could be wrong, it is an even more severe test.”


“If we observe a difference of 1.5, with a 95% confidence interval from 1 to 2, all three predictions are confirmed with an alpha level of 0.05, but the prediction in Figure 1C has passed the most severe test since it was confirmed in a test that had a higher capacity of demonstrating the prediction is false.”
“Note that the three tests differ in severity even when they are tested with the same Type 1 error rate.”
“…a preregistration document should give us all the information that allows future readers to evaluate the severity of the test. Researchers should also specify when they will conclude their prediction is not supported.”
“Preregistration adds value for people who, based on their philosophy of science, increase their trust in claims that are supported by severe tests and predictive successes.”
“But researchers often have other goals such as developing measures, descriptive investigations, exploratory studies, and theoretical studies such as mathematical models or simulation studies (de Groot, 1969). In these cases, other philosophies of science might provide a better description of the goal scientists have.”
“…I personally feel that the discussion about preregistration in the psychological literature has often been unproductive, exactly because positive externalities were not separated from the goal of preregistering a study.”
“Preregistration requires researchers to carefully think through their analyses before collecting the data. This can lead to useful improvements when designing a study, but this goal can also be achieved by careful thought.”
“Working through a checklist for a preregistration might remind researchers to think about issues they would otherwise have forgotten, but the study is improved regardless of whether their answers on this checklist is made public.”
“Preregistration is a tool, and researchers who use it should do so because they have a goal that preregistration facilitates. If the use of a tool is detached from a philosophy of science it risks becoming a heuristic.”
“Researchers should not choose to preregister because it has become a new norm, but they should preregister because they can justify based on their philosophy of science how preregistration supports their goals.”
To read the article, click here.


You must be logged in to post a comment.