[From the working paper, “Open science and modified funding lotteries can impede the natural selection of bad science” By Paul Smaldino, Matthew Turner, and Pablo Contreras Kallens, posted at OSF Preprints]
“…we investigate the influence of three key factors on the natural selection of bad science: publication of negative results, improved peer review, and criteria for funding allocation.”
“…our results indicate that funding agencies have the potential to play an outsized role in the improvement of science by promoting research that passes tests for rigor. Such tests include commitments to open data and open code (which permit closer scrutiny), preregistration and registered reports, and research programs with strong theoretical bases for their hypotheses. Wide-scale adoption of these and similar criteria for funding agencies can, in theory, have substantial long-term effects on reducing the rates of false discoveries.”
“Our results also highlight the contribution of open science practices. Improving peer review and reducing publication bias led to improvements in the replicability of published findings in our simulations. Alone, each of these open science improvements required extremely high levels of implementation to be effective.”
“Fortunately, we also found that the two factors could work in tandem to improve the replicability of the published literature at lower, though still high, levels of efficacy.”
“… in the absence of specific incentives at the funding or hiring level for methodological rigor, open science improvements are probably not sufficient to stop the widespread propagation of inferior research methods, despite the optimism that often surrounds their adoption.”
[From the press release “Can machines determine the credibility of research claims? The Center for Open Science joins a new DARPA program to find out” from the Center for Open Science]
“The Center for Open Science (COS) has been selected to participate in DARPA’s new program Systematizing Confidence in Open Research and Evidence (SCORE) with a 3-year cooperative agreement potentially totaling more than $7.6 million. This program represents an investment by DARPA to assess and improve the credibility of social and behavioral science research.”
“DARPA identifies the purpose of SCORE is “to develop and deploy automated tools to assign ‘confidence scores’ to different SBS research results and claims. Confidence scores are quantitative measures that should enable a DoD consumer of SBS research to understand the degree to which a particular claim or result is likely to be reproducible or replicable.” If successful, consumers of scientific evidence–researchers, funders, policymakers, etc.–would have readily available information about the uncertainty associated with that evidence.”
“COS will coordinate a massive collaboration of researchers from every area of the social and behavioral sciences to conduct replication and reproducibility studies.”
“Researchers interested in potentially joining this program to conduct replication or reproduction studies are encouraged to review the Call for Collaborators.”
To read the press release, click here.
[From the blog “Why you shouldn’t say ‘this study is underpowered'” by Richard Morey, posted at Towards Data Science, at Medium. com]
“The first thing to clear up, as I’ve stated above, is that study or an experiment is not underpowered; rather: A design and test combination can be underpowered for detecting hypothetical effect sizes of interest.”
“Suppose worked for a candy company and had determined that our new candy would be either green or purple. We’ve been tasked with finding out whether people like green or purple candy better, so we construct an experiment where we give people both and see which one they reach for first. For each person, the answer is either “green” or “purple”. Let’s call θ the probability of picking purple first, so we’re interested in whether θ>.5 (that is, purple is preferred).”
“Suppose we fix our design at N=50 people picking candy colors. We now need a test. … “If 31 or more people pick purple, we’ll say that purple is preferred (i.e., θ>.5)”. We can now draw the power/sensitivity curve for the design and test, given all the potential, hypothetical effect sizes (shown in the figure to the left, as curve “A”).”

“A “power analysis” is simply noting the features of this curve (perhaps along with changing the potential design by increasing N). Look at curve A. If green candies are preferred (θ<.5) we have a very low chance of mistakenly saying that purple candies are preferred (this is good!). If purple is substantially preferred (θ>.7), we have a good chance of correctly saying that purple is preferred (also good!).”
“Now let’s consider another test for this design: “If 26 or more people pick purple, we’ll say that purple is preferred (θ>.5)”. This could be motivated by saying that we’ll claim that purple is truly preferred whenever the data seem to “prefer” purple. This is curve “B” in the figure above. Let’s do a power analysis. If purple is substantially preferred (θ>.7), we are essentially sure to correctly say that purple is preferred (good!). If green candies are preferred, (θ<.5) we could have a high chance (over 40%) of mistakenly saying that purple candies are preferred (this is bad!).”
“A design sensitivity analysis — what is often called a power analysis — is just making sure the sensitivity is low in the region where the “null” is true (in common lingo, “controlling” α), and making sure the power/sensitivity is high where we’d care about it. None of this has anything to do with “estimating” power from previous results, or anything to do with the actually true effect.”
[From the working paper “Predicting the Replicability of Social Science Lab Experiments” by Altmejd et al., posted at BITSS Preprints]
“We have 131 direct replications in our dataset. Each can be judged categorically by whether it succeeded or failed, by a pre-announced binary statistical criterion. The degree of replication can also be judged on a continuous numerical scale, by the size of the effect estimated in the replication compared to the size of the effect in the original study.”
“Our method uses machine learning to predict outcomes and identify the characteristics of study-replication pairs that can best explain the observed replication results.”
“We divide the objective features of the original experiment into two classes. The first contains the statistical design properties and outcomes: among these features we have sample size, the effect size and p-value originally measured, and whether a finding is an effect of one variable or an interaction between multiple variables.”
“The second class is the descriptive aspects of the original study which go beyond statistics: these features include how often a published paper has been cited and the number and past success of authors, but also how subjects were compensated.”
“We compare a number of popular machine learning algorithms … and find that a Random Forest (RF) model has the highest performance.”
“Even with our fairly small data set, the model can forecast replication results with substantial accuracy —around 70%.”
“The statistical features (p-value and effect size) of the original experiment are the most predictive. However, the accuracy of the model is also increased by variables such as the nature of the finding (an interaction, compared to a main effect), number of authors, paper length and the lack of performance incentives.”
“Our method could be used in pre- and post-publication assessment, … For example, when a paper is submitted an editorial assistant can code the features of the paper, plug those features into the models, and derive a predicted replication probability. This number could be used as one of many inputs helping editors and reviewers to decide whether a replication should be conducted before the paper is published.”
“Post-publication, the model could be used as an input to decide which previously published experiments should be replicated.”
[From the article, “Statistical Rituals: The Replication Delusion and How We Got There” by Gerd Gigerenzer, published in Advances in Methods and Practices in Psychological Science]
“The “replication crisis” has been attributed to misguided external incentives gamed by researchers (the strategic-game hypothesis). Here, I want to draw attention to a complementary internal factor, namely, researchers’ widespread faith in a statistical ritual and associated delusions (the statistical-ritual hypothesis).”
“The crucial delusion is that the p value specifies the probability of a successful replication (i.e., 1 – p), which makes replication studies appear to be superfluous. A review of studies with 839 academic psychologists and 991 students shows that the replication delusion existed among 20% of the faculty teaching statistics in psychology, 39% of the professors and lecturers, and 66% of the students.”
“Two further beliefs, the illusion of certainty (e.g., that statistical significance proves that an effect exists) and Bayesian wishful thinking (e.g., that the probability of the alternative hypothesis being true is 1 – p), also make successful replication appear to be certain or almost certain, respectively.”
“In every study reviewed, the majority of researchers (56%–97%) exhibited one or more of these delusions.”
“Whereas the strategic-game hypothesis takes the incentives as given, the statistical-ritual hypothesis provides a deeper explanation of the roots of the replication crisis. Researchers are incentivized to aim for the product of the null ritual, statistical significance, not for goals that are ignored by it, such as high power, replication, and precise competing theories and proofs. The statistical-ritual hypothesis provides the rationale for the very incentives chosen by editors, administrators, and committees. Obtaining significant results became the surrogate for good science.”
To read the article, click here.
[From the working paper “The Unappreciated Heterogeneity of Effect Sizes:Implications for Power, Precision, Planning of Research, and Replication” by David Kenny and Charles Judd, posted at Open Science Framework (OSF)]
“The goal of this article is to examine the implications of effect size heterogeneity for power analysis, the precision of effect estimation, and the planning of both original and replication research.”
“…given effect heterogeneity, the power in testing an effect in any particular study is different from what conventional power analyses suggest, and the extent to which this is true depends on the magnitude of the heterogeneity. Whenever a conventional power analyses yields a power value less than .50, an estimate that allows for heterogeneity is greater; and when a conventional analysis yields a power value greater than .50, the estimate given heterogeneity is less.”
“…given some heterogeneity and a small to moderate average effect size, there is a non-trivial chance of finding a significant effect in the opposite direction from the average effect size reported in the literature. …This probability increases as N increases.”
“Many analysts recommend what might be called a one-basket strategy. They put all their eggs in the one basket of a very large N study. … such a strategy is misguided … given the same total N and heterogeneity, multiple studies are better than a single study.”
“In the presence of heterogeneity, our results show that power is not nearly as high as it would seem and that even large N studies may have a non-trivial chance of finding a result in the opposite direction from the original study. This makes us question the wisdom of placing a great deal of faith in a single replication study. The presence of heterogeneity implies that there are a variety of true effects that could be produced.”
[From the paper “Specification Searching and Significance Inflation AcrossTime, Methods and Disciplines” by Eva Vivalt, published in the Oxford Bulletin of Economics and Statistics]
“…This paper leverages a database of impact evaluation results collected by AidGrade, a US non-profit organization that focuses on gathering the results of impact evaluations…”
“…This paper examines specification searching by comparing the number of barely significant results with the number of barely insignificant results around the conventional cut-off significance level of 5%.”
“…This paper finds that studies using randomized experiments exhibit less specification searching than those that do not.”
“…these biases appear less pronounced than has previously been found in some of the other social sciences, and there appears to be little difference between papers written by researchers in economics-related disciplines and papers written by researchers in other fields like public health.”
“…A second contribution is that specification searching is shown to not be static, but a bias that evolves. In particular, RCTs have exhibited significantly less bias over time, while quasi-experimental studies have, if anything, exhibited more pronounced biases over time.”
To read the article, click here.
[From the syllabus for “POLI 229: Social Science Replication”, taught by Gareth Nellis at the University of California San Diego]
“The purpose of this class is to learn how to do cutting-edge empirical research in the social sciences by replicating others’ work. For each class, we will have a non-UCSD faculty member visit campus. A week before their visit, they will circulate a working paper—typically one drawing on an experimental or quasi-experimental design—along with the data and code needed to reproduce the results. Small teams of graduate students will reanalyze the data, and propose further robustness tests and extensions.”
“The class is aimed at students in the second, third, and fourth years of the PhD program in political science. A strong understanding of probability, regression, and causal inference is required. Prior knowledge of R is highly recommended.”
“The class tries to instill excellent workflow habits, and to teach tools that will make your research easier to conduct and more transparent. For this reason, the software and presentational requirements will be quite strictly enforced. All class work should be done using an R-RMarkdown-Git integration via RStudio and Github.”
“Replications, weekly memos, and pre-analysis plans should be written and coded in single, continuous RMarkdown (Rmd) documents. You should knit to html or pdf for written submissions, and to beamer or Xaringan for slide presentations. Everything should be “one-click” replicable, meaning all text and analysis output compiles from a raw Rmd with a single click of “Knit” in RStudio.”
“We will be getting to know DeclareDesign, a new R package that makes it straightforward to run Monte Carlo simulations of complex research designs, and thus to assess their properties (e.g. power, bias, RMSE). Follow this guide to get started, and play with the vignettes in the design library.”
To read the full syllabus, click here.
[From the paper “Good and Bad Replications in Political Science: How Replicators and Original Authors (Should) Talk to Each Other” by Nicole Janz and Jeremy Freese, prepared for presentation at the MZES Open Social Science Conference 2019]
“We propose two main ways to conduct a well-conducted, constructive and publishable replication:”
“First, your study should be carefully and transparently planned. … make very clear if the replication aims to conduct a duplication or replication study, or both, and have a clear list for yourself of what differences between the results you expect when you use new data or methods.”
“Second, a good replication study should also use sensitive and professional wording when referring to the original study to avoid embarrassment for the original author(s). We emphasize that binary judgments such as ‘failed replication’ can do more harm than good.”
“How ‘far’ must your results deviate from the original work before claiming that some effects could not be confirmed? Take into account that different data and measurements (replication) will naturally yield different results …”
“Be transparent and reproducible: Why have you chosen the original study for replication?”
“… your study must have an extensive and clear methods part, and potentially a supplement, to give all details on how the new findings were produced.”
“Ideally, a replication would be pre-registered to eliminate reporting flexibility (Zigerell 2017). … transparency can avoid later accusations of p-hacking or deliberate error hunting. Have someone crosscheck your replication before journal submission.”
”Always try to talk about the study, not the author, to make it less personal.”
“Gary King advises that a copy of the paper should first be sent to the original author by his students, who can respond to the critique and comment on possible failed replications. In psychology, there have been calls to involve the original authors even earlier, as part of the planning or pre-registration process …”
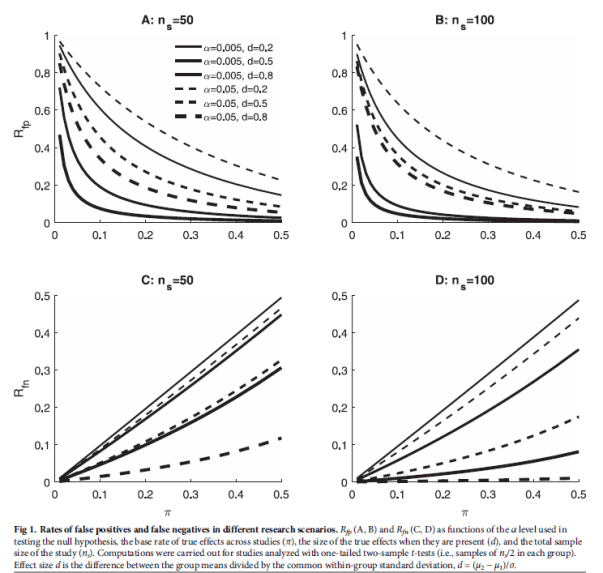
[From the article “The quest for an optimal alpha” by Jeff Miller and Rolf Ulrich, published in PLOS One]
“The purpose of the present article is to show exactly what is necessary to provide a principled justification for a particular α level. …we identify the parameters of a research scenario that must be considered when choosing the optimal α level …We conclude that no definitive case for any particular α level has yet been made, because advocates of particular α levels have never specified—even approximately—the key research parameters whose values are needed to identify the optimal α.”
“Fig 1 illustrates how these rates change with the researcher’s α level, showing results for two different sample sizes (ns), three different effect sizes (d), and a wide range of base rates (π). Critically, for every combination of sample size, effect size, and base rate, the rate of FPs [False Positives] is higher with α = 0.05 than with α = 0.005. In contrast, the rate of FNs [False Negatives] is always higher for α = 0.005 than for α = 0.05. Thus, these two types of decision errors trade off against one another as α changes, and a quantitative model incorporating the frequencies and costs of these errors must be used to choose α.”
“In the end, the question of which α level researchers should use simply cannot be answered without a detailed quantitative model incorporating not only the researcher’s choices of α level and sample size, but also the underlying characteristics of the research scenario and the costs and benefits of reaching the different possible correct and incorrect conclusions. To that end, traditional statistical decision models can be adapted to models of the research process, and we suggest that advocates of any particular α level should use such models—in conjunction with estimates of base rates and payoffs—to give their arguments a firm objective foundation.”
To read the article, click here.

You must be logged in to post a comment.