The Replication Network
Furthering the Practice of Replication in Economics
Want to Be In on the Final Stage of the SCORE Project? A Call for Collaborators from COS
The SCORE project is entering its final phase of conducting reproductions (repeating the original analysis with original data) and replications (testing the same claim with new data) on a stratified random sample of claims from papers across the social-behavioral sciences.
Here is your opportunity to contribute to these efforts for non-human subjects research (non-HSR) work, meaning projects that use existing data and do not require any additional IRB review steps. We’d love to have your collaboration!
This spreadsheet contains all of the non-HSR projects available, with different tabs corresponding to different project categories.
This announcement outlines the different project categories at a high level. More details can be found in this explanation of our terminology, as well as specific instructions tailored for replication projects (DARs) and reproduction projects.
There are six project categories, depending on two factors: the type of data used and the number of claims selected.
Data types: (i) Datasets provided by the author (PBR/ADR), (ii) Original observations reconstructed from the underlying data sources (SDR), and (iii) New observations that were not already analyzed in the original article (DAR)
Number of claims: (i) Just one claim per article (singe-trace) and (ii) A minimum of five claims per article (bushel), unless fewer are available.
We have identified the most feasible projects in separate tabs. We highly encourage collaborators to review these projects first. Projects are highly feasible if we already have the data in hand, or if we’ve identified the data sources as relatively simple to obtain.
Finally, we have included a column in each tab labeled ‘high_incentive,’ coded as yes or no. If a project is coded as ‘yes,’ it means the payment for completing the project will be higher than other projects from the same category. The full set of payments can be found here.
Your next steps
Select one or more projects you anticipate being able to complete, by adding your name in the respective signup cell. Please consider whether you’ll be able to obtain the necessary materials before signing up.
After signing up but before submitting the commitment form, please confirm you can access all of the necessary materials to complete the project. If this requires author data that COS does not currently have but that you think could be made available, please do not reach out to the authors directly. Instead, please contact COS for assistance in getting in touch with the authors.
After you have obtained all of the materials necessary to begin your project, please complete the commitment form linked in the spreadsheet, after which someone from COS will provide you access to an OSF project and preregistration form.
Please keep the following privacy statement in mind as you complete these steps: Other teams are making predictions about the outcomes of many different studies, not knowing which studies have been selected for replication/reproduction. As a consequence, the success of this project requires full confidentiality of the research process. This includes privacy about which studies have been selected for replication and all aspects of the discussion about these replication designs.
Et tu, Finance?
[Excerpts are taken from the article “The hidden ‘replication crisis’ of finance”, by Robin Wigglesworth, published at Financial Times online.]
“It may sound like a low-budget Blade Runner rip-off, but over the past decade the scientific world has been gripped by a “replication crisis” — the findings of many seminal studies cannot be repeated, with huge implications. Is investing suffering from something similar?”
“That is the incendiary argument of Campbell Harvey, professor of finance at Duke University. He reckons that at least half of the 400 supposedly market-beating strategies identified in top financial journals over the years are bogus. Worse, he worries that many fellow academics are in denial about this.”
“Harvey is not some obscure outsider or performative contrarian attempting to gain attention through needless controversy. He is the former editor of the Journal of Finance, a former president of the American Finance Association, and an adviser to investment firms like Research Affiliates and Man Group. He has written more than 150 papers on finance, several of which have won prestigious prizes.”
“To understand what the ‘replication crisis’ is, how it has happened and its implications for finance, it helps to start at its broader genesis. In 2005, Stanford medical professor John Ioannidis published a bombshell essay titled “Why Most Published Research Findings Are False ”, which noted that the results of many medical research papers could not be replicated by other researchers. Subsequently, several other fields have turned a harsh eye on themselves and come to similar conclusions. The heart of the issue is a phenomenon that researchers call “p-hacking”.”
“P-hacking is when researchers overtly or subconsciously twist the data to find a superficially compelling but ultimately spurious relationship between variables. It can be done by cherry-picking what metrics to measure, or subtly changing the time period used. Just because something is narrowly statistically significant, does not mean it is actually meaningful. A trading strategy that looks golden on paper might turn up nothing but lumps of coal when actually implemented.”
“AQR, a prominent quant investment group, is also sceptical that there are hundreds of durable and successful factors that can help investors beat markets, but argues that the “replication crisis” brouhaha is overdone. Earlier this year it published a paper that concluded that not only could the majority of the studies it examined be replicated, they still worked “out of sample” — in actual live trading —and were actually further corroborated by international data.”
“Harvey is unconvinced by the riposte, and will square up to the AQR paper’s authors at the American Finance Association’s annual meeting in early January. “That’s going to be a very interesting discussion,” he promises.”
To read the full article, click here.
Exciting Collaboration Opportunity with the SCORE Team at COS
The SCORE team at the Center for Open Science (COS) is looking for committed individuals to help conduct data-analytic replications (DARs) and reproductions.
In general, DARs involve using new data and the same methodological and analytic approach that was used in the original study to replicate the claim identified by SCORE, producing the statistical evidence found in “claim 4” (one or more inferential tests or pieces of statistical evidence). For DARs, collaborators may use different data sources or the same data sources as the original study (e.g., longitudinal dataset, U.S. Census, etc), however the observations used in the replication must be distinct from the observations used in the original study (e.g., newer waves of the same longitudinal dataset, a newer version of the U.S. Census, etc).
Reproductions involve using the original data and the same analytic approach that was used in the original study to reproduce the inferential test(s) or statistical evidence identified by SCORE in “claim 4.”
Reproduction types
Within the SCORE program, there are 3 types of reproductions
1) Push Button Reproduction (PBR): Uses the original data and the original analytic code (either shared from the original authors or collected from an online repository/journal website). If a PBR fails to produce sensible output, you will conduct an Author-Data reproduction.
2) Author Data Reproduction (ADR): Uses the original data (either shared from the original authors or collected from an online repository/journal website) and new/revised analytic code generated by the SCORE collaborator.
3) Source Data Reproduction (SDR), applicable when the original study used existing data: The SCORE collaborator reconstructs the dataset used in the original analysis (by using information from the original paper and any additional information from the original author) and generates new analytic code.
The data-analytic replications and each of the three types of reproductions are further broken down based on the method of claim extraction:
– Single-trace papers: Only a single claim trace is extracted from the article which includes exactly one statistically significant inferential test result.
– Bushel papers: As many independent claim traces are extracted as possible, which may include non-inferential quantitative evidence, non-significant evidence, and multiple inferential test results in the same claim.
How to get involved
You will self select into a project-analysis type using the sign-up sheet linked below before completing a form to confirm your interest and timeline feasibility. You will see that the commitment form corresponding to each project is linked directly in the spreadsheet.
If you sign-up for a bushel reproduction/replication, you will commit to reproducing/replicating as many claims as possible, aiming for at least 5 unless fewer claims are included in the bushel claims spreadsheet.
If you are interested in executing a data-analytic replication (DAR) or a reproduction, please review the in-depth instructions linked below and claim papers using this SIGN-UP SHEET. When you claim a project, be sure to also complete the commitment form linked in the sign-up sheet. High priority projects are highlighted in green.
For bushel papers, the columns ‘has replication’ and ‘has reproduction’ indicate whether or not at least one analysis has already been performed within the context of the SCORE program. Those projects with ‘TRUE’ in this field will be easier to complete because we likely have relevant materials in hand.
If you would like to review what data and materials we’ve already collected for a given project, if anything, please let us know and we will provide a view-only link.
You may review general instructions and expectations for each project type linked below. When you complete the commitment form and are matched to a project, you will receive access to the corresponding OSF project, your preregistration form, and any other relevant materials.
Bushel claim spreadsheets can be found in the OSF project linked in the sign-up sheet. If you are interested, please follow the link, review the project wiki, and click the paper from among the full list of bushel papers included in the project.
Note that you should attempt to access all of the necessary data after signing up but before completing the commitment form. Please do not reach out to any of the original authors directly; if you suspect that the data is readily available but require assistance to access it (e.g., original author contact, funding to access the data, etc.) please reach out to us after you’ve added your name to the sign-up sheet.
Privacy Statement: Other teams are making predictions about the outcomes of many different studies, not knowing which studies have been selected for replication/reproduction. As a consequence, the success of this project requires full confidentiality of the research process. This includes privacy about which studies have been selected for replication and all aspects of the discussion about these replication designs.
IREE Scores a Top Score in TOP Factor
The International Journal for Re-Views in Empirical Economics (IREE) is the only journal in economics solely dedicated to publishing replications. Recently, IREE was evaluated by TOP Factor. TOP Factor is an initiative launched by the Center for Open Science to assess journals according to “a values-aligned rating of journal policies as a counterweight to metrics that incentivize journals to publish exciting results regardless of credibility” (see here). The assessment of IREE‘s journal policies resulted in a journal score of 13 points. This puts IREE in 4th place among all 136 economic journals rated by TOP Factor, ahead of the American Economic Review, Econometrica, Plos One, and Science.
TOP Factor provides an alternative to metrics such as the journal impact factor (JIF). It constitutes a first step towards evaluating journals based on their quality of process and implementation of scholarly values. “Too often, journals are compared using metrics that have nothing to do with their quality,” says Evan Mayo-Wilson, Associate Professor in the Department of Epidemiology and Biostatistics at Indiana University School of Public Health-Bloomington. “The TOP Factor measures something that matters. It compares journals based on whether they require transparency and methods that help reveal the credibility of research findings.” (see COS announcement of TOP factor, 2020).
TOP Factor is based on the Transparency and Openness Promotion (TOP) Guidelines, a framework of eight standards that summarize behaviors that can improve transparency and reproducibility of research such as transparency of data, materials, code, and research design, preregistration, and replication.
Editor Martina Grunow announced that she was very pleased with this rating, as TOP Factor reflects exactly what IREE stands for: reducing the publication bias towards literally incredible and non-reproducible results and the resulting “publish-or-perish” culture. Like TOP Factor, IREE promotes the reproducibility and transparency of published results and scientific discourse in economics based on high-quality and credible research results.
Fudging Data About Dishonesty
[Excerpts are taken from the blog “Evidence of Fraud in an Influential Field Experiment About Dishonesty” posted by Uri Simonsohn, Joe Simmons, Leif Nelson and anonymous researchers at Data Colada]
“This post is co-authored with a team of researchers who have chosen to remain anonymous. They uncovered most of the evidence reported in this post.”
“In 2012, Shu, Mazar, Gino, Ariely, and Bazerman published a three-study paper in PNAS reporting that dishonesty can be reduced by asking people to sign a statement of honest intent before providing information (i.e., at the top of a document) rather than after providing information (i.e., at the bottom of a document).”
“In 2020, Kristal, Whillans, and the five original authors published a follow-up in PNAS entitled, “Signing at the beginning versus at the end does not decrease dishonesty”.
“Our focus here is on Study 3 in the 2012 paper, a field experiment (N = 13,488) conducted by an auto insurance company … under the supervision of the fourth author. Customers were asked to report the current odometer reading of up to four cars covered by their policy.”
“The authors of the 2020 paper did not attempt to replicate that field experiment, but they did discover an anomaly in the data…our story really starts from here, thanks to the authors of the 2020 paper, who posted the data of their replication attempts and the data from the original 2012 paper.”
“A team of anonymous researchers downloaded it, and discovered … very strong evidence that the data were fabricated.”
“Let’s start by describing the data file. Below is a screenshot of the first 12 observations:”

“You can see variables representing the experimental condition, a masked policy number, and two sets of mileages for up to four cars. The “baseline_car[x]” columns contain the mileage that had been previously reported for the vehicle x (at Time 1), and the “update_car[x]” columns show the mileage reported on the form that was used in this experiment (at Time 2).”
“On to the anomalies.”
Anomaly #1: Implausible Distribution of Miles Driven
“Let’s first think about what the distribution of miles driven should look like…we might expect…some people drive a whole lot, some people drive very little, and most people drive a moderate amount.”
“As noted by the authors of the 2012 paper, it is unknown how much time elapsed between the baseline period (Time 1) and their experiment (Time 2), and it was reportedly different for different customers. … It is therefore hard to know what the distribution of miles driven should look like in those data.”
“It is not hard, however, to know what it should not look like. It should not look like this:”
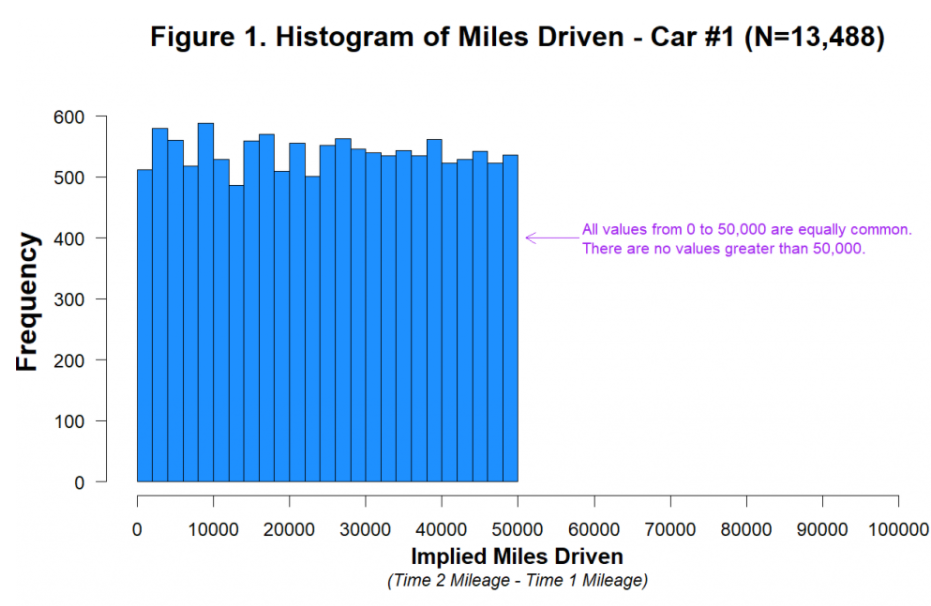
“First, it is visually and statistically (p=.84) indistinguishable from a uniform distribution ranging from 0 miles to 50,000 miles. Think about what that means. Between Time 1 and Time 2, just as many people drove 40,000 miles as drove 20,000 as drove 10,000 as drove 1,000 as drove 500 miles, etc. This is not what real data look like, and we can’t think of a plausible benign explanation for it.”
“Second, there is some weird stuff happening with rounding…”
Anomaly #2: No Rounded Mileages At Time 2
“The mileages reported in this experiment … are what people wrote down on a piece of paper. And when real people report large numbers by hand, they tend to round them.”
“Of course, in this case some customers may have looked at their odometer and reported exactly what it displayed. But undoubtedly many would have ballparked it and reported a round number.”
“In fact, as we are about to show you, in the baseline (Time 1) data, there are lots of rounded values.”
“But random number generators don’t round. And so if, as we suspect, the experimental (Time 2) data were generated with the aid of a random number generator (like RANDBETWEEN(0,50000)), the Time 2 mileage data would not be rounded.”

“The figure shows that while multiples of 1,000 and 100 were disproportionately common in the Time 1 data, they weren’t more common than other numbers in the Time 2 data.”
“These data are consistent with the hypothesis that a random number generator was used to create the Time 2 data.”
“In the next section we will see that even the Time 1 data were tampered with.”
Interlude: Calibri and Cambria
“Perhaps the most peculiar feature of the dataset is the fact that the baseline data for Car #1 in the posted Excel file appears in two different fonts. Specifically, half of the data in that column are printed in Calibri, and half are printed in Cambria.”
“The analyses we have performed on these two fonts provide evidence of a rather specific form of data tampering.”
“We believe the dataset began with the observations in Calibri font. Those were then duplicated using Cambria font. In that process, a random number from 0 to 1,000 (e.g., RANDBETWEEN(0,1000)) was added to the baseline (Time 1) mileage of each car, perhaps to mask the duplication.”
“In the next two sections, we review the evidence for this particular form of data tampering.”
Anomaly #3: Near-Duplicate Calibri and Cambria Observations
“…the baseline mileages for Car #1 appear in Calibri font for 6,744 customers in the dataset and Cambria font for 6,744 customers in the dataset. So exactly half are in one font, and half are in the other. For the other three cars, there is an odd number of observations, such that the split between Cambria and Calibri is off by exactly one (e.g., there are 2,825 Calibri rows and 2,824 Cambria rows for Car #2).”
“… each observation in Calibri tends to match an observation in Cambria.”
“To understand what we mean by “match” take a look at these two customers:”

“The top customer has a “baseline_car1” mileage written in Calibri, whereas the bottom’s is written in Cambria. For all four cars, these two customers have extremely similar baseline mileages.”
“Indeed, in all four cases, the Cambria’s baseline mileage is (1) greater than the Calibri mileage, and (2) within 1,000 miles of the Calibri mileage. Before the experiment, these two customers were like driving twins.”
“Obviously, if this were the only pair of driving twins in a dataset of more than 13,000 observations, it would not be worth commenting on. But it is not the only pair.”
“There are 22 four-car Calibri customers in the dataset. All of them have a Cambria driving twin…there are twins throughout the data, and you can easily identify them for three-car, two-car, and unusual one-car customers, too.”
“To see a fuller picture of just how similar these Calibri and Cambria customers are, take a look at Figure 5, which shows the cumulative distributions of baseline miles for Car #1 and Car #4.”
“Within each panel, there are two lines, one for the Calibri distribution and one for the Cambria distribution. The lines are so on top of each other that it is easy to miss the fact that there are two of them:”

Anomaly #4: No Rounding in Cambria Observations
“As mentioned above, we believe that a random number between 0 and 1,000 was added to the Calibri baseline mileages to generate the Cambria baseline mileages. And as we have seen before, this process would predict that the Calibri mileages are rounded, but that the Cambria mileages are not.”
“This is indeed what we observe:”

Conclusion
“The evidence presented in this post indicates that the data underwent at least two forms of fabrication: (1) many Time 1 data points were duplicated and then slightly altered (using a random number generator) to create additional observations, and (2) all of the Time 2 data were created using a random number generator that capped miles driven, the key dependent variable, at 50,000 miles.”
“We have worked on enough fraud cases in the last decade to know that scientific fraud is more common than is convenient to believe… There will never be a perfect solution, but there is an obvious step to take: Data should be posted.”
“The fabrication in this paper was discovered because the data were posted. If more data were posted, fraud would be easier to catch. And if fraud is easier to catch, some potential fraudsters may be more reluctant to do it. … All of our journals should require data posting.”
“Until that day comes, all of us have a role to play. As authors (and co-authors), we should always make all of our data publicly available. And as editors and reviewers, we can ask for data during the review process, or turn down requests to review papers that do not make their data available.”
“A field that ignores the problem of fraud, or pretends that it does not exist, risks losing its credibility. And deservedly so.”
To read the full blog, click here.
Replication Leads to High Profile Retraction
[Excerpts are taken from the article “Retracted: Risk Management in Financial Institutions” “ by Adriano Rampini, S. Viswanathan, and Guillaume Vuillemey, published in the Journal of Finance]
“The authors hereby retract the above article, published in print in the April 2020 issue of The Journal of Finance. A replication study finds that the replication code provided in the supplementary information section of the article does not reproduce some of the central findings reported in the article.”
“Upon reexamination of the work, the authors confirmed that the replication code does not fully reproduce the published results and were unable to provide revised code that does. Therefore, the authors conclude that the published results are not reliable and that the responsible course of action is to retract the article and return the Brattle Group Distinguished Paper Prize that the article received.”
Last Call for Metascience 2021 Submissions
FROM THE METASCIENCE 2021 ORGANIZING COMMITTEE:
You’re invited to submit an event or lightning talk proposal to the Metascience 2021 Conference by this Wednesday, June 30 to help contribute to the enrichment of attendees’ perspectives of the field of metascience. Take a moment to view full submission criteria and tips at metascience2021.org/submit.
Metascience 2021 will explore the themes of metascience and the scientific process through a global, interdisciplinary, cross-sector lens. This year’s virtual format takes place across time zones at peak hours to promote voices in metascience across regions.
Thank you for considering this opportunity to be a part of the global metascience discussion to advance scientific progress.

Open Invitation to the Webinar Launch of the InSPiR2eS International Research Alliance
InSPiR2eS is a new global research network primarily aimed at research training and capacity building, resting on a foundation theme of responsible science (for some more details, please refer to the 2-pager outline here).
Whether you are a current network member or not, you are warmly invited to the 1-hour webinar launch of the network taking place during the window, 22-24th June.
For your convenience, the Zoom launch is offered in 3 separate repeat events summarised below (please see here for a doc that gives more details confirming equivalent dates/times for your part of the world):
#1: Tuesday 22nd June at 18:00 Australian Eastern Standard Time (AEST)
Topic: Robert Faff’s Zoom Meeting #1 launching InSPiR2eS
Join from a PC, Mac, iOS or Android: https://bond.zoom.us/j/91798395671
#2: Wednesday 23rd June at 15:00 AEST
Topic: Robert Faff’s Zoom Meeting #2 launching InSPiR2eS
Join from a PC, Mac, iOS or Android: https://bond.zoom.us/j/99592757933
#3: Thursday 24th June at 06:00 AEST
Topic: Robert Faff’s Zoom Meeting #3 launching InSPiR2eS
Join from a PC, Mac, iOS or Android: https://bond.zoom.us/j/92796833442
If you are interested in joining the Zoom launch of InSPiR2eS, please register ASAP at the Google Docs link here.
Finally, please share this open invitation with whomever you think might be interested. Thank you!


You must be logged in to post a comment.