[From the blog “The Persistence of False Paradigms in Low-Power Sciences” by Pascal Michaillat, posted on the BITSS website]
“It is commonly believed that the lack of experimental evidence typical in the social sciences slows but does not prevent the replacement of existing theories by newer, better ones.”
“In a recent paper, George Akerlof and I evaluate this belief using a simple model of scientific research and promotion. The model allows us to conduct a thought experiment. Imagine that two theories, one better and one worse, are competing for acceptance by the scientific community. Under which conditions will the better theory eventually prevail?”
“To mirror the environment in which scientific production is evaluated, we allow scientists to be slightly biased toward other scientists with similar beliefs. This type of bias is widespread in human communities. It corresponds to what sociologists call “homophily” and what social psychologists call “intergroup bias”.”
“The bias has also been observed in science. Scientists have been found to favor others from the same school of thought at every level of academic evaluation: hiring, award of grants and honors, conference invitations, tenure evaluations, and so on.”
“Using this model, we find that when a field lacks evidence to discriminate between theories, even with only a slight amount of bias, there is a risk that inferior paradigms may prevail. Specifically, the conditions under which inferior paradigms prevail when they are in contest with better ones are these: if scientific tests lack power, or if tests are rarely used in determining admittance of a paradigm into the fellowship of established scientists, then the chances of getting trapped in an inferior paradigm are high.”
“Lack of power does not just slow scientific progress; with even the slightest bias, it may bring it to a halt.”
To read the blog, click here.
[From the blog “P-values 101: An attempt at an intuitive but mathematically correct explanation” by Xenia Schmalz, posted at Xenia Schmalz’s blog]
“…what exactly are p-values, what is p-hacking, and what does all of that have to do with the replication crisis? Here, a lot of stats-savvy people shake their heads and say: “Well, it’s complicated.” Or they start explaining the formal definition of the p-value, which, in my experience, to someone who doesn’t already know a lot about statistics, sounds like blowing smoke and nitpicking on wording.”
“… the logic behind it is relatively simple, and I often wonder why people don’t explain p-values (and p-hacking) in a much less complicated way. So here goes my attempt at an intuitive, maths-free, but at the same time mathematically correct explanation.”
[From the blogpost “Too Many Social Scientists, Too Few Truths to Discover” by Jay P. Greene, posted at his blog]
“I’m teaching a seminar for the Honors College this semester on BS. It’s been a lot of fun and the students have been great. Last week we were discussing the prevalence of BS in social science. In particular, we were discussing the problems of file drawer and publication bias, p-hacking, and spurious relationships. While considering why there is so much of this BS in social science we stumbled upon a possible explanation: perhaps there are just too many social scientists under too much pressure to regularly discover and report truths about human behavior when there just aren’t enough truths to be discovered.”
“Roughly estimating, there are at least 2,000 institutions worldwide that give priority to research and expect their faculty to produce it regularly. And there are at least 50 active researchers in the social sciences at each of those institutions who depend on publishing novel insights about human beings, sometimes annually, in order to obtain and keep their jobs as well as receive promotions. In my back of the envelope calculation, there is demand for “discovering” roughly 100,000 true things about human behavior each year.”
“Now let’s consider the supply side. My general worldview is that there is a very limited number of universally true things we could say about human behavior. I’d wager that there are no more than several dozen true things that generally apply to human beings across time, place, and context. And perhaps there are several hundred more contingently true things, observations that would be true for specified groups of people in particular circumstances. The number of universally or contingently true observations we could make about human behavior may not exceed a thousand.”
“…If I’m right, several implications follow. The prevalence of BS in social science, including replication problems, file-drawer and publication bias, p-hacking, etc…, cannot be addressed with improved training or enforcement of more rigorous standards. The pressure to make claims that are not really true is simply too great to be controlled by ethics or peers facing the same pressure.”
“…I don’t hold out much hope for the social sciences beginning to thin their ranks of researchers … But thinking about the mismatch between how many people are searching for generalizations about human behavior and how many valid generalizations they are able to find is still useful for diagnosing how the social sciences may have gone astray.”
To read the article, click here.
[From the paper “Preregistration and reproducibility” by Eirik Strømland, forthcoming in the Journal of Economic Psychology]
“I present a simple model in which the research community is populated by agents who may report their results unconditionally or conditionally on statistical significance and show that greater reliance on preregistration improves the estimation of the effect sizes through increasing the share of “frequentist” researchers. As replicators are likely to estimate statistical power based on the published effect sizes, preregistration is therefore also expected to improve reproducibility rates.”
“Table 1 shows that in a low-powered setting, the inflation bias is generally sizeable unless the share of frequentist researchers is very high. In the worst-case scenario, the reported effect will be, on average, 2.2 times as high as the true effect, and researchers who estimate the power of a replication study based on this effect will set a sample size that in reality gives them only 24% power.”
“The results shown in Table 1 depend on the assumptions made about statistical power. If the statistical power in the original study is high (80%), then the inflation bias will generally be very small even in the worst-case scenario with only selective reporting. The reason is that for a constant and conventional test statistics (e.g. the t-test), an increase in sample size leads to higher values of the test statistic for lower values of the estimate. The truncated sampling distribution would then approach the “frequentist” sampling distribution … and even replicators who base their power estimates on selectively reported estimates would obtain quite accurate power estimates.”
“However, … as long as the statistical power is below about 50%, the sampling distribution of only statistically significant effects will be different enough from the unconditional sampling distribution that the difference between the two distributions will be large in practice.”
To read the article, click here (NOTE: The article is behind a paywall.)
[From the article “DARPA Wants to Solve Science’s Reproducibility Crisis With AI” by Adam Rogers, published in Wired]
“A Darpa program called Systematizing Confidence in Open Research and Evidence—yes, SCORE—aims to assign a “credibility score” … to research findings in the social and behavioral sciences.”
“Darpa has promised $7.6 million to the Center for Open Science, a nonprofit organization that’s leading the charge for reproducibility. COS is going to aggregate a database of 30,000 claims from the social sciences.”
“For 3,000 of those claims, the Center will either attempt to replicate them or subject them to a prediction market—asking human beings to essentially bet on whether the claims would replicate or not.”
“The replication work is an assessment of ground-truth fact,” a final call on whether a study held up or failed, says Tim Errington, director of research at COS. “That’s going to get benchmarked against algorithms.”
“In other words, first you get a database, then you do some human assessment, and then the future machine overlords come in? “I would say ‘machine partners,’” says Adam Russell, an anthropologist and SCORE program manager at Darpa. He’s hoping that the machine-driven “phase II” of the program…will lead to algorithms that will outperform bettors in a prediction market.”
[From the article “Replications on the Rise” by Stuart Buck, posted at Arnold Ventures]
“Once a poorly rewarded scientific value, replication has seen a boom with studies in everything from psychology to dogs.”
“A significant tipping point was the Reproducibility Project in Psychology, which Arnold Ventures funded, and which was carried out by our grantee Center for Open Science. That project organized more than 200 psychology labs around the world to systematically redo 100 experiments published in top psychology journals.”
“Since 2015, we have seen an explosion in similar efforts. Particularly in social-behavioral science, there are now many replication projects that have organized labs around the world to replicate one or more scientific findings.”
– “The Social Sciences Replication Project (coordinated by the Center for Open Science) sought to replicate all 21 social science experiments published in Science and Nature between 2010 and 2015.”
– “The Many Labs series of studies (1 through 5) have all sought to systematically replicate psychology studies with many labs around the world. Many Labs 1 came out in 2014 and replicated 13 psychological findings; Many Labs 2 did the same for another 28 classic and newer findings; Many Labs 3 looked at whether psychological effects studied on college students would vary depending on the time of the semester; and Many Labs 4 and 5 are in progress.”
– “The Psychological Science Accelerator is a “globally distributed network of psychological science laboratories (currently more than 350),” with the goal of coordinating massive psychology studies across diverse settings.”
– “The Many Babies projects (of which there are now three) are coordinating multiple labs to study infant cognition (such as how babies develop a theory of mind or how they react to speech).”
– “In education, Many Numbers is a project to replicate research on how children develop math skills, while Many Classes will study questions such as curriculum across ‘dozens of contexts, spanning a range of courses, institutions, formats, and student populations.'”
– “The Many Smiles Project is organizing 18 labs from 17 countries to re-examine a contested question in psychology about whether people actually become happier when they are tricked into smiling (by being asked to hold a pencil between their teeth).”
– “The “Many” tagline has even reached animal research, including Many Primates (a collaboration to study primate cognition, such as short-term memory, in much larger samples than are typical for the field), and Many Dogs (a collaboration to study dog cognition).”
“More fields – from medicine to sociology to biology – should see the value in large replication projects that systematically take stock of whether research stands the test of time.”
To read the article, click here.
Category: NEWS & EVENTS
Tags: Arnold Ventures, Center for Open Science, Experimental Economics Replication Project, Many Babies, Many Dogs, Many Labs, Many Numbers, Many Primates, Many Smiles, Psychological Science Accelerator, replications, Reproducibility Project in Psychology, Social Sciences Replication Projets
Replication researchers cite inflated effect sizes as a major cause of replication failure. It turns out this is an inevitable consequence of significance testing. The reason is simple. The p-value you get from a study depends on the observed effect size, with more extreme observed effect sizes giving better p-values; the true effect size plays no role. Significance testing selects studies with good p-values, hence extreme observed effect sizes. This selection bias guarantees that on average, the observed effect size will inflate the true effect size[1]. The overestimate is large, 2-3x, under conditions typical in social science research. Possible solutions are to increase sample size or effect size or abandon significance testing.
[1] By “inflate” I mean increase the absolute value.
Figure 1 illustrates the issue using simulated data colored by p-value. The simulation randomly selects true effect sizes, then simulates a two group difference-of-mean study with sample size n=20 for each true effect size. The effect size statistic is standardized difference, aka Cohen’s d, and p-values are from the t-test. The figure shows a scatter plot of true vs. observed effect size with blue and red dots depicting nonsignificant and significant studies. P-values are nonsignifiant (blue) for observed effect sizes between about -0.64 and 0.64 and improve as the observed effect size grows. The transition from blue to red at ± 0.64 is a critical value that sharply separates nonsignificant from significant results. This value depends only on n and is the least extreme significant effect size for a given n.
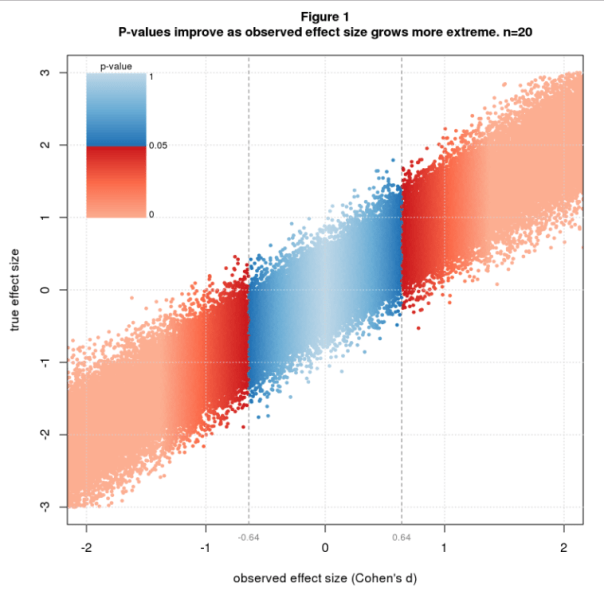
Technical note: The sharpness of the boundary is due to the use of Cohen’s d in conjunction with the t-test. This pairing is mathematically natural because both are standardized, meaning both are relative to the sample standard deviation. In fact, Cohen’s d and the t-statistic are essentially the same statistic, related by the identities d = t∙sqrt(2/n) and t = d∙sqrt(2/n) (for my simulation scenario).
The average significant effect size depends on both d and n. I explore this with a simulation that fixes d to a few values of interest, sets n to a range of values, and simulates many studies for each d and n.
From what I read in the blogosphere, the typical true effect size in social science research is d=0.3. Figure 2 shows a histogram of observed effect sizes for d=0.3 and n=20. The significant results are way out on the tails, mostly on the right tail, which means the average will be large. Figure 3 shows the theoretical equivalent of the histogram (the sampling distribution) for the same parameters and two further cases: same d but larger n, and same n but larger d. Increasing n makes the curve sharper and reduces the critical effect size, causing much more of the area to be under the red (significant) part of the curve. Increasing d slides the curve over, again putting more of the area under the red. These changes reduce the average significant effect size bringing it closer to the true value.
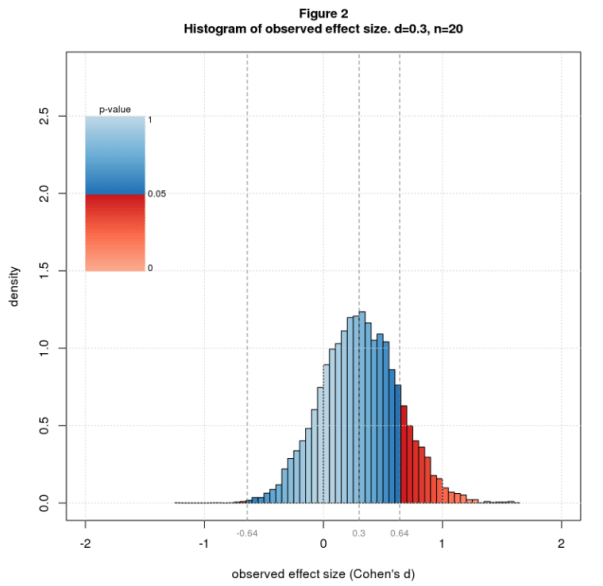
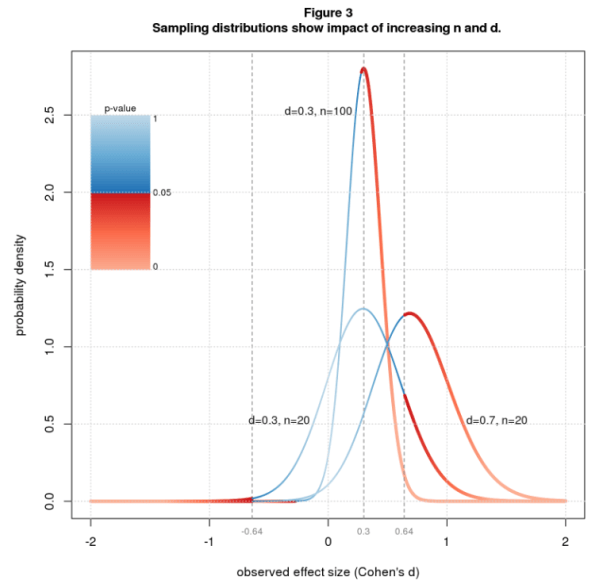
Figure 4 plots the average significant effect size for d between 0.3 and 0.7 and n ranging from 20 to 200. In computing the average, I only use the right tail, reasoning that investigators usually toss results with the wrong sign whether significant or not, as these contradict the authors’ scientific hypothesis. Let’s look first at n=20. For d=0.3 the average is 0.81, an overestimate of 2.7x. A modest increase in effect size helps a lot. For d=0.5 (still “medium” in Cohen’s d vernacular), the average is 0.86, an overestimate of 1.7x. For d=0.7, it’s 0.93, an overestimate of 1.3x. To reduce the overestimate to a reasonable level, say 1.25x, we need n=122 for d=0.3, but only n=47 for d=0.5, and n=26 for d=0.7.

Significance testing is a biased procedure that overestimates effect size. This is common knowledge among statisticians yet seems to be forgotten in the replication literature and is rarely explained to statistics users. I hope this post will give readers a visual understanding of the problem and under what conditions it may be worrisome. Shravan Vasishth offers another good explanation in his excellent TRN post and related paper.
You can mitigate the bias by increasing sample size or true effect size. There are costs to each. Bigger studies are more expensive. They’re also harder to run and may require more study personnel and study days, which may increase variability and indirectly reduce the effect size. Increasing the effect size typically involves finding study conditions that amplify the phenomenon of interest. This may reduce the ability to generalize from lab to real world. All in all, it’s not clear that the net effect is positive.
A cheaper solution is to abandon significance testing. The entire problem is a consequence of this timeworn statistical method. Looking back at Figure 1, observed effect size tracks true effect size pretty well. There’s uncertainty, of course, but that seems an acceptable tradeoff for gaining unbiased effect size estimates at reasonable cost.
[From the Twitter thread started by @JessieSunPsych]
Jessie Sun (@JessieSunPsych) relayed the following question that was raised at a recent Psychology conference: “At what point can a theory be falsified (e.g., if the effect size is d = .02)? We often just predict the direction of the effect, but do we need to think about the specificity of effect sizes?”
This led to a large number of responses. Daniel Lakens () replied by giving three links to works that he has either authored or co-authored, each addressing a piece of the answer.
Among other things, this blog recommends that a researcher should “power your experiment such that you, or someone else, can conduct a similarly-sized experiment and have high power for detecting an interesting difference from your study. We need to stop thinking about studies as if they are one-offs, only to be interpreted once in light of the hypotheses of the original authors. This does not support cumulative science.”
Equivalence testing helps one to decide whether failure to reject means null effect.
The latter addresses how to test a theory (or the claims of a prior paper) that a given parameter takes a range of values. It also encourages researchers to choose alternative hypotheses that would be unlikely to be true unless the theory was correct, so rejection of the null actually means something.
To read the Twitter thread, click here.
Nicole Janz (University of Nottingham, @PolSciReplicate) has a set of great resources for those looking for an example of a pre-registration assignment for undergraduates (this for a political science course).
The slides to accompany the assignment are here.
The template the students are to follow is here.
And an actual pre-analysis plan is posted here.
For some related slides on “Ex post replication & Ex ante documentation”, click here.
[From the blog “Misinterpreting Tests, P-Values, Confidence Intervals & Power” by Dave Giles, posted at his blogsite, Econometrics Beat]
“Today I was reading a great paper by Greenland et al. (2016) that deals with some common misconceptions and misinterpretations that arise not only with p-values and confidence intervals, but also with statistical tests in general and the “power” of such tests.”
“These comments by the authors in the abstract for their paper sets the tone of what’s to follow rather nicely:”
“A key problem is that there are no interpretations of these concepts that are at once simple, intuitive, correct, and foolproof. Instead, correct use and interpretation of these statistics requires an attention to detail which seems to tax the patience of working scientists. This high cognitive demand has led to an epidemic of shortcut definitions and interpretations that are simply wrong, sometimes disastrously so – and yet these misinterpretations dominate much of the scientific literature.”
“The paper then goes through various common interpretations of the four concepts in question, and systematically demolishes them!”
“The paper is extremely readable and informative. Every econometrics student, and most applied econometricians, would benefit from taking a look!”
To read Greenland et al.’s (2016) paper, click here.

Comments Please!
Please post comments on Twitter or Facebook, or contact me by email at natg@shore.net.
Nat Goodman is a retired computer scientist living in Seattle Washington. His working years were split between mainstream CS and bioinformatics and orthogonally between academia and industry. As a retiree, he’s working on whatever interests him, stopping from time-to-time to write papers and posts on aspects that might interest others.