IREE is a young journal, started in 2017. Richard Easterlin and Jeffrey Wooldridge serve on the journal’s Advisory Board. It has already attracted prestigious authors including David Roodman, Joachin Wagner, David Jaeger, Theodore Joyce, Robert Kaestner, and François Roubaud. A recent replication study of research by Crépon, Devoto, Duflo, and Parienté received much attention with the awarding of the Nobel Prize in Economics to Esther Duflo.
IREE is the only journal in economics completely devoted to replications. It is listed on the AEA’s Resources for Economists on the Internet under “Replication Studies” (see below).
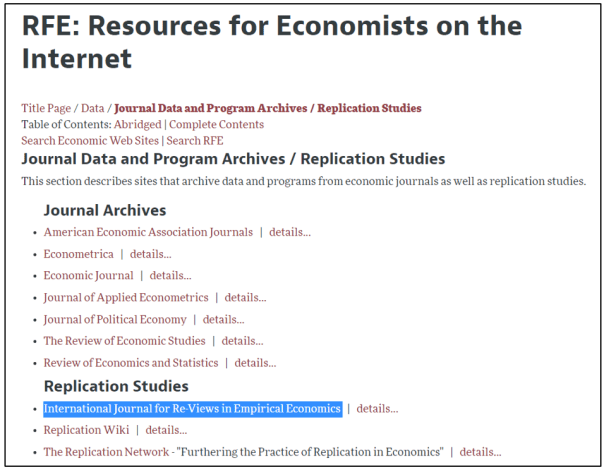
A key element of IREE’s mission is to publish high quality replications regardless of the outcome. That is, both successful and failed replication attempts are welcome. All that matters is that the research is an honest and competent attempt to verify the correctness, robustness, and generalizability of single empirical findings.
Topics of replicated studies may be within Microeconomics, Macroeconomics, Experimental Economics, Finance, and Management. IREE also accepts replication studies from adjacent disciplines that are closely related to economics.
Guidelines for authors are posted here. Key items include:
– Replicators need to have informed the original authors about the replication prior to submission.
– In the case of a failed replication, replicators should make a good faith effort with the original authors to reconcile any discrepancies. A copy of the correspondence should be kept and provided upon request from the journal.
– Replicators are required to submit their data and programming code along with their manuscript for review. Upon acceptance, the data and code will be permanently stored in a publicly accessible data archive.
IREE is an e-journal and articles are published continuously. Publications are instantly available at IREE’s website and distributed via EconStor and RePEc’s EconPapers and IDEAS. All article are open access and there are no publishing fees.
To see a list of replication studies published by IREE, click here.
Finally, should you want a quick assessment if your replication study is appropriate for IREE, you can contact the managing editor, Martina Grunow, iree@zbw.eu.
To learn more about the journal, click here.
The bottom line is this: If you or your students are considering publishing a replication study, consider IREE!
Confidence intervals get top billing as the alternative to significance. But beware: confidence intervals rely on the same math as significance and share the same shortcominings. Confidence intervals don’t tell where the true effect lies even probabilistically. What they do is delimit a range of true effects that are broadly consistent with the observed effect.
Confidence intervals, like p-values and power, imagine we’re repeating a study an infinite number of times, drawing a different sample each time from the same population. Though unnatural for basic, exploratory research, it’s a useful mathematical trick that let’s us define the concept of sampling distribution – the distribution of expected results – which in turn is the basis for many common stats. The math is the same across the board; I’ll start with a pedantic explanation of p-values, then generalize the terminology a bit, and use the new terminology to explain confidence intervals.
Recall that the (two-sided) p-value for an observed effect dobs is the probability of getting a result as or more extreme than dobs under the null. “Under the null” means we assume the population effect size dpop=0. In math terms, the p-value for dobs is the tail probability of the sampling distribution – the area under the curve beyond dobs – times 2 to account for the two sides. Recall further that we declare a result to be significant and reject the null when the tail probability is so low that we deem it implausible that dobs came from the null sampling distribution.
Figure 1a shows a histogram of simulated data overlaid with the sampling distribution for sample size n=40 and dpop=0. I color the sampling distribution by p-value, switching from blue to red at the conventional significance cutoff of p=0.05. The studies are simple two group difference-of-mean studies with equal sample size and standard deviation, and the effect size statistic is standardized difference (aka Cohen’s d). The line at dobs=0.5 falls in the red indicating that we deem the null hypothesis implausible and reject it.
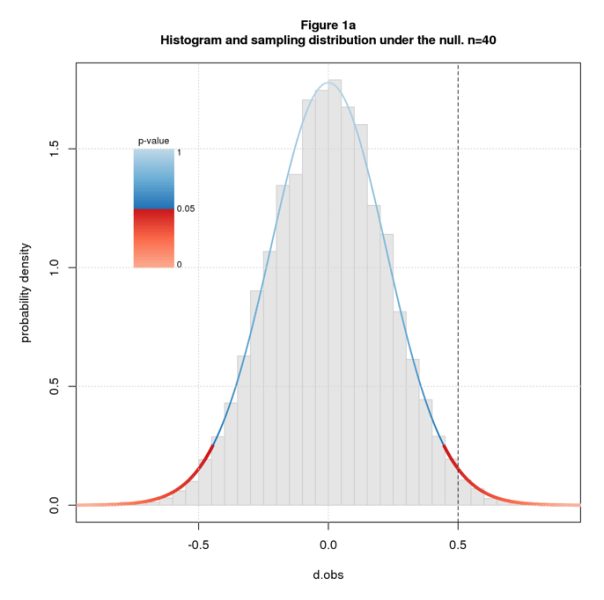

Figure 1b shows sampling distributions for n=40 and several values of dpop. The coloring, analogous to Figure 1a, indicates how plausible we deem dobs given n and dpop. The definition of “plausibility value” (plaus) is the same as p-value but for arbitrary dpop. dobs=0.5 is in the red for the outer values of dpop but in the blue for the inner ones. This means we deem dobs=0.5 implausible for the outer values of dpop but plausible for the inner ones. The transition from implausible to plausible happens somewhere between dpop=0 and 0.1; the transition back happens between 0.9 and 1.
Plausibility is a function of three parameters: n, dpop, and dobs. We can compute and plot plaus-values for any combination of the three parameters.
Figure 2a plots plaus vs. dpop for dobs=0.5 and several values of n. The figure also shows the limits of plausible dpops at points of interest. As with significance, we can declare “plausibility” at thresholds other than 0.05. From the figure, we see that the limits gets tighter as we increase n or the plausibility cutoff. For n=40 and the usual 0.05 cutoff, the limits are wide: [0.5, 0.94]. For n=400 and a stringent cutoff of 0.5, the limits are narrow: [0.45,0.55]. This makes perfect sense: (1) all things being equal, bigger samples have greater certainty; (2) a higher cutoff means we demand more certainty before deeming a result plausible, ie, we require that dpop be closer to dobs.
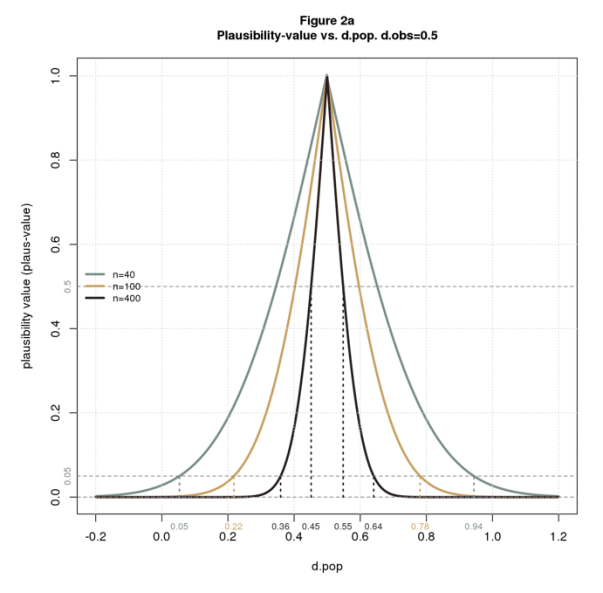

The plausibility limits in Figure 2a are consistent with Figure 1b. Both figures say that with n=40 and dobs=0.5, dpop must be a little more than 0 and a little less than 1 to deem the solution plausible.
Now I’ll translate back to standard confidence interval terminology: confidence level is 1 – plaus usually stated as a percentage; confidence intervals are plausibility limits expressed in terms of confidence levels. Figure 2b restates 2a using the standard terminology. It’s the same but upside down. This type of plot is called a consonance curve.
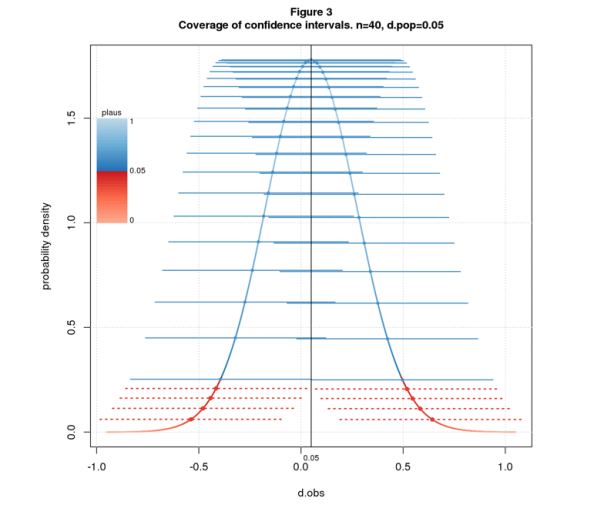
A further property of confidence intervals, called the coverage property, states that if we repeatedly sample from a fixed dpop and compute the C% confidence intervals, C% of the intervals will contain dpop. Figure 3 illustrates the property for 95% confidence intervals, n=40, and dpop=0.05. The figure shows the sampling distribution colored by plaus-value, and confidence intervals as solid blue or dashed red lines depending on whether the interval covers dpop. I arrange the intervals along the sampling distribution for visual separation.
Many texts use the coverage property as the definition of confidence interval and plausibility limits as a derived property. This points the reader in the wrong direction: since C% of intervals cover dpop, it’s natural to believe there’s a C% chance that the interval computed from an observed effect size contains dpop. This inference is invalid: the interval delimits the range of dpops that are close enough to dobs to be deemed plausible. This says nothing about probability.
Stats likes strong words: “significance”, “power”, “confidence”. Words matter: “significant” suggests important; “power” suggests the ability to get the right answer; “95% confidence” suggests we’re pretty darn sure; “95% confidence interval” and “95% of intervals cover dpop” suggest a 95% chance that the true effect falls in the interval. None of these inferences are valid.
Statistics is fundamentally about uncertainty. Why hide this behind the smog of strong words? There’s no surefire way to prevent the misuse of statistics, but better language can only help. Words that scream “weak and uncertain” – words like “plausible” – are a step in the right direction.
COMMENTS PLEASE!
Nat Goodman is a retired computer scientist living in Seattle Washington. His working years were split between mainstream CS and bioinformatics and orthogonally between academia and industry. As a retiree, he’s working on whatever interests him, stopping from time-to-time to write papers and posts on aspects that might interest others.
[Excerpts taken from the article “A Team Approach to Tackling the Psychology Replication Crisis” by Dalmeet Singh Chawla, published in Undark]
“In 2008, psychologists proposed that when humans are shown an unfamiliar face, they judge it on two main dimensions: trustworthiness and physical strength…To date, the 2008 paper — written by Nikolaas Oosterhof of Dartmouth College and Alexander Todorov of Princeton University — has attracted more than a thousand citations…”
“Now, one large-scale study suggests that although the 2008 theory may apply in many parts of the world, the overall picture remains complex…The study is the first conducted through the Psychological Science Accelerator, a global network of more than 500 labs in more than 70 countries.”
“The accelerator, which launched in 2017, aims to re-do older psychology experiments, but on a mass-scale in several different settings. The effort is one of many targeting a problem that has plagued the discipline for years: the inability of psychologists to get consistent results across similar experiments, or the lack of reproducibility.”
“The accelerator’s founder, Christopher Chartier, a psychologist at Ashland University in Ohio, modeled the project in part on physics experiments, which often have large international teams to help answer the big questions.”
“Despite being branded as an accelerator, the project has needed two years to produce its first study, partly because it takes longer to coordinate within large teams and collate data from multiple locations.”
“Even at this modest pace, each accelerator project should produce knowledge “likely to be greater than that produced by 100 typical solo or small-team projects,” says Simine Vazire, a psychologist at the University of California, Davis, who is not involved with the accelerator. ‘Even though it looks slow, it is actually likely to produce discoveries and knowledge at a faster rate than the heaps of little studies we are used to pumping out.'”
“One goal for the accelerator, Chartier adds, is to operate as a model for academia more widely.”
“After an initial call for submissions…The study selection committee, a group of five researchers, then assesses whether the accelerator has the bandwidth to carry out the study.”
“For studies that pass this stage, Chartier tracks down around 10 experts — within and outside the accelerator — to review each submission.”
“Following the review, all accelerator members rate each project via an online survey. The selection committee decides which projects are accepted based on all the feedback and ratings.”
“Once it’s decided which study the accelerator network labs are going to work on, the authors often publish a registered report outlining their approach, after quality control checks from experts, but before data collection stage — a process known as pre-registration, which has become popular in psychology in recent years.”
“The Psychological Science Accelerator isn’t the only project seeking to address the reproducibility problem. Other recently conducted efforts with similar goals include the Reproducibility Project: Psychology, Social Sciences Replication Project, Many Labs, and Many Labs 2, among others.”
“But the accelerator is unique in two ways, Chartier says. First, collaborators plan to continue to work on large-scale efforts indefinitely. And second, the accelerator isn’t necessarily limited to replication studies, opening it to novel and exploratory work.”
“So far, the accelerator hasn’t attracted much funding and remains largely a labor of love or part of the daily job of those involved. For now, the accelerator plans to turn around roughly three studies every year, Chartier says, but could potentially aim for more with some financial support.”
To read the article, click here.
[Excerpts taken from the article “Variability in the analysis of a single neuroimaging dataset by many teams” by Thomas Nichols, Russell Poldrack, Tom Schonberg and 194 others, posted at BioRXiv]
“Data analysis workflows in many areas of science have become exceedingly complex, with a large number of processing and analysis steps that involve many possible choices at each of those steps (i.e., “researcher’s degrees of freedom”).”
“Simulation studies have shown that these differences in analytic choices can have substantial effects on results, but it has not been clear to what degree such variability exists and how it affects reported scientific conclusions in practice. Recent work in psychology has attempted to address this through a “many analysts” approach, in which the same dataset was analyzed by a large number of groups…”
“In the Neuroimaging Analysis Replication and Prediction Study (NARPS; http://www.narps.info), we applied a similar approach to the domain of functional magnetic resonance imaging (fMRI), where analysis workflows are complex and highly variable.”
“Neuroimaging researchers were solicited via social media and at the 2018 annual meeting of The Society for Neuroeconomics to participate in the analysis of this dataset. Seventy analysis teams participated in the study.”
“The teams were provided with the raw data…as well as optional preprocessed data…They were asked to analyze the data to test nine ex-ante hypotheses (Table 1), each of which consisted of a description of significant activity in a specific brain region in relation to a particular feature of the experimental design.”
“They were given up to 100 days (varying based on the date they joined) to analyze the data and report for each hypothesis whether it was supported based on a whole-brain corrected analysis (yes / no)….the only instructions given to the teams were to perform the analysis as they usually would in their own research groups and to report the binary decision based on their own criteria…”
“The fraction of teams reporting a significant result for each hypothesis is presented in Table 1…. The extent of the variation in results across teams can be measured as the fraction of teams reporting a different result than the majority of teams.”
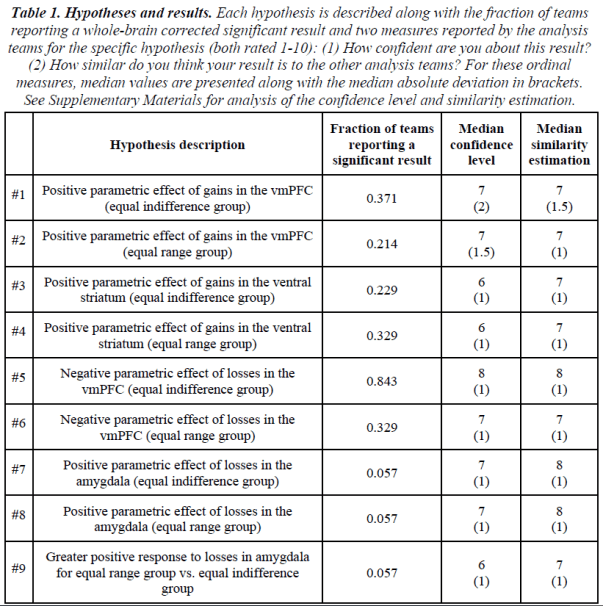
“The second aim of NARPS was to test whether peers in the field could predict the results obtained in aggregate by the analysis teams using prediction markets.”
“…we ran two separate prediction markets: one involving members from the analysis teams (“team members” prediction market) and an additional independent market for researchers in the field who had not participated in the analysis (“non-team members” prediction market).”
“Overall, n = 65 traders actively traded in the “non-team members” prediction market and n = 83 traders actively traded in the “team members” prediction market.”
“Except for the prediction of a single hypothesis (Hypothesis #7) in the “team members” set of markets, all predictions were outside the 95% confidence intervals of the fundamental values (i.e. the proportion of teams reporting a significant result for each hypothesis; see Figure 3…”

Discussion
“The analysis of a single functional neuroimaging dataset by 70 independent analysis teams revealed substantial variability in reported binary results, with high levels of disagreement across teams of their outcomes on a majority of tested pre-defined hypotheses.”
“Prediction markets demonstrated that researchers generally overestimated the likelihood of significant results across hypotheses, even those who had analyzed the data themselves, reflecting substantial optimism bias by researchers in the field.”
“Given the substantial amount of analytic variability we found to be present in practice, leading to substantial variability of reported hypothesis results with the same data, we believe that steps need to be taken to improve the reproducibility of data analysis outcomes.”
To read the article, click here.
[Excerpts taken from the article “Editor’s Corner”, by Travis Lybbert, published in The Exchange, the newsletter of the Agricultural & Applied Economics Association]
“In my time as AJAE editor over the past four years, an interesting crisis for our profession – and, indeed, for the wider social sciences…As this crisis unfolded, we as editors frequently discussed appropriate responses for the AJAE and how we might increase research transparency. These discussions led to some substantive revisions to the AJAE Editorial Policies…”
“We have elevated our data and code sharing policy from a suggestion to an expectation…the share of empirical articles in the AJAE that are accompanied by data and code…has increased from 8% in 2015 to nearly 20% today.”
“With support from the AAEA, we also recently launched a ‘Data and Code Verification Pilot’ that supports a small team of analysts that use these files to verify “push button” replicability of the tables and figures in the manuscript.”
“Addressing the crisis of confidence of the past decade will require more than changes in journal policies and editorial practices, but the AJAE Editorial Board is striving to play a constructive role in building greater transparency and restoring confidence in empirical analysis.”
[Excerpts taken from the article, “The Statistics of Replication” by Larry Hedges, pubished in the journal Methodology]
Background
“Some treatments of replication have defined replication in terms of the conclusions obtained by studies (e.g., did both studies conclude that the treatment effect was positive, or not…).”
“For example, one might say that investigator Smith found an effect (by which we mean that Smith obtained a statistically significant positive treatment effect) while investigator Jones failed to replicate (meaning that Jones did not obtain a statistically significant positive treatment effect).”
“While this definition of replication may be in accord with common language usage, it is not useful as a scientific definition of replication for both conceptual and statistical reasons.”
“…decisions about replication…should be based on effect sizes…”
“When effects are identical (homogeneous across studies) θ1 = …= θk.”
“The Q-statistic is used in testing for heterogeneity of effects across studies in meta-analysis.”
“…the distribution of Q…is determined only by k, the number of studies, and the noncentrality parameter λ…”
“The noncentrality parameter λ is a natural way to characterize heterogeneity when studies are assumed to be fixed, but there are alternatives, particularly when the studies themselves are considered a random sample from a universe of studies – the so called random effects model for meta-analysis…”
“If studies are a random sample from a universe of studies, so that their effect parameters are also a sample from a universe of effect parameters with mean μ and variance τ2, then τ2 (the between-studies variance component of effects) is a natural way to characterize heterogeneity of effects.”
How Should Replication Be Defined?
“It is logical to think of defining replication across studies as corresponding to the case when all of the effect parameters are identical, that is, when θ1 = …= θk or equivalently when λ = 0, or when τ2 = 0. This situation might be characterized as exact replication.”
“It is also possible to think of that if the θi are quite similar, but not identical then the results of the studies replicate “approximately.” When the value of λ (or τ2) is “small enough,” that is, smaller than some negligible value λ0 (or τ02), we might conclude that the studies approximately replicate.”
“Because replication is a concern of essentially all sciences, it is possible to examine empirical evidence about replication in various sciences to provide a context for understanding replication in the social sciences.”
“The example of physics is particularly illuminating because it is among the most respected sciences and because it has a long tradition of examining empirical evidence about replication…”
“Determining the values of the so-called fundamental constants of mathematical physics is a continuing interest in physics. Theory suggests that the speed of light in a vacuum is a universal constant and there has been a considerable amount of empirical work to determine its value.”
“Figure 1 shows the values of the studies estimating the speed of light.”

“Each determination is given by a dot surrounded by one standard error bars…It is clear that…the estimates differ by more than would be expected by chance due to their estimation error. In fact, the Q-statistic is Q = 36.92 with a p-value of less than .01.”
“This has led to an understanding that reasonable scientific practice should be to tolerate a small amount of heterogeneity in estimates as negligible for scientific purposes.”
“The principle used to arrive at an acceptable level of heterogeneity in physics is that competent experimenters attempt to reduce the biases in their experiments to a point that they are small compared to the…variance due to estimation errors (ν).”
“…conventions in physics, medicine, and personnel psychology provide a range of definitions of negligible heterogeneity from λ0 = (k-1)/4 to λ0 = 2(k-1)/3 or alternatively, τ02/ν = 1/4 to τ02/ν = 2/3.”
“Note that all of these definitions of negligible heterogeneity are social conventions among a group of scientists as all conventions for interpretation must be.”
Conclusion about Defining Replication
“The definition of replication is more complex than it first appears. While exact replication is logically appealing, it is too strict to be useful, even in well-established sciences like physics, chemistry, or medicine.”
“Approximate replication has proven more scientifically useful in these sciences and in personnel psychology. However, it requires establishment of conventions of negligible heterogeneity among groups of scientists. The fact that conventions have been established in these sciences shows that it is possible to do so.”
Statistical Analysis of Replication
The statistical test for heterogeneity typically used in meta-analysis…[is based on]…the Q-statistic…”
“…the details of the statistical approaches to studying replication depend on three considerations that are largely conceptual: How the hypotheses are structured (whether the burden of proof lies with replication or with failure to replicate), how replication is defined (as exact or approximate replication), and whether the studies are conceived as a fixed set or a random sample from a universe of studies…”
“…evaluation of the sensitivity (e.g., statistical power) of tests based on Q is somewhat different when studies are considered fixed than when they are considered random…”
“…tests of approximate replication have the same test statistic Q, but larger critical values than tests of exact replication and, therefore, have lower statistical power.”
“…the results of the analysis can only be conclusive if the test has high power to detect meaningful amounts of heterogeneity. The inherent problem with this formulation is that concluding that studies replicate involves accepting the null hypothesis…”
“A different way to structure the test is to alter the burden of proof so that it lies on replication (not failure to replicate).”
Conclusion about Statistical Analyses for Replication
“The major conclusion about testing hypotheses about replication is that different tests are possible and the choice among them is not automatic, but a principled analytic decision that requires some care.”
Design of Replication Studies
“The design of an ensemble of two or more studies to investigate replication might seem straightforward, but quite different designs have been used with little justification of why that design was appropriate.”
“For example, the Open Science Collaborative (2016) and Camerer et al. (2018) chose to use a total of k = 2 studies (the original and one replication), while the Many Labs Project (Klein et al., 2014) used as many as k = 36 studies (the original and 35 replications) of each result. One might ask which, if either design is adequate and why.”
“The simplest conception of the design to test whether Study 1 can be replicated is to simply repeat the study, so that the ensemble is two studies (Study 1 and Study 2).”
“The statistical power of a test for replication based on a total of k = 2 studies is limited by the study with the least statistical power. This means that it will be virtually impossible to achieve a high power test of replication unless both studies have very high power.”
“Moreover, this analysis was based on a test for exact replication. Test for approximate replication have lower power than the corresponding test for exact replication, so they would have even lower power in this situation than a test for exact replication.”
“…one design that might seem appealing is to use several replication studies (i.e., more than one replication of the original), and then to compare the results of replication studies (as a group) to the original study.”
“…such a strategy is mathematically equivalent to combining the estimates from all of the replication studies into one “synthetic study” and computing an effect size estimate (and its variance) for that synthetic replication study.”
“The analysis of the difference between the original study and the synthetic replication study is subject to exactly the same limitations of analyses comparing two studies that are described in this article. In other words, the sensitivity of that analysis is limited by the least sensitive of the two studies being compared (which will usually be the original study).”
“Thus, no matter how many replication studies are conducted, it may be impossible to obtain a design of this type with adequate sensitivity.”
Overall Conclusions
“Exact replication is logically appealing, but appears to be too strict a definition to be satisfied even in the most mature sciences like physics or medicine.”
“Approximate replication is a more useful concept, but requires the development of social conventions in each area of science. Moreover, tests of approximate replication are less powerful than those of exact replication, leading to lower sensitivity in analyses of approximate replication.”
“For any particular definition of (exact or approximate) replication, several different, but perfectly valid, analyses are possible. They differ depending on whether a studies-fixed or studies-random framework is used and whether the burden of proof is imposed on failure to replicate (so that rejection of the null hypothesis leads to rejection of replication) or on replication (so that rejection of the null hypothesis leads to rejection of failure to replicate).”
“Finally there have been unappreciated problems in the design of a replication investigation (an ensemble of studies to study replication). The sensitivity of an ensemble of two studies is limited by the least sensitive of the studies, so that an ensemble of two studies will almost never be adequate to evaluate replication.”
To read the article, click here.
[Excerpts taken from the article, “Pre-analysis Plans: A Stocktaking” by George Ofosu and Daniel Posner, posted at George Ofosu’s website at the London School of Economics]
“We draw a representative sample of PAPs and analyze their content to determine whether they are sufficiently clear, precise, and comprehensive as to meaningfully limit the scope for fishing and post-hoc hypothesis adjustment. We also assess whether PAPs do, in fact, tie researchers hands by comparing publicly available papers that report the findings of pre-registered studies to the PAPs that were registered when those studies were initiated.”
“…we drew a representative sample of PAPs from the universe of studies registered on the AEA and EGAP registries between their initiation and 2016.”
“All 195 PAPs in our sample were coded according to a common rubric that recorded details of the hypotheses that were pre-specified, the dependent and independent variables that would be used in the analysis, the sampling strategy, the inclusion and exclusion rules, and the statistical models to be run, among other features.”
“For the sub-sample of 93 PAPs for which publicly available papers were available, we added further questions that addressed how faithfully the pre-specified details of the analysis were adhered to in the resulting paper.”
“We supplemented our coding of PAPs with an anonymous survey of PAP users to elicit their experiences with writing and using PAPs in their research.”
“The overwhelming majority of the 195 PAPs we coded were from field (63%), survey (27%), or lab (4%) experiments; observational studies comprised just 4% of our sample.”
“In our sample of PAPs, 77% of primary dependent variables and 93% of independent/treatment variables were judged to have been clearly specified.”
“In 44% of PAPs, the number of pre-specified control variables was judged to be unclear, making it nearly impossible to compare what was pre-registered with what is ultimately presented in the resulting paper.”
“…only 68% of PAPs were judged to have spelled out the precise statistical model to be tested and just 37% specified how they would estimate their standard errors.”
“…just 25% of PAPs specified how they would deal with missing values and/or attrition; just 13% specified how they would deal with noncompliance; just 8% specified how they would deal with outliers; and just 20% specified how they would deal with covariate imbalances.”
“Ninety percent of the PAPs we coded were judged to have specified a clear hypothesis.”
“While 34% of PAPs specified between one and five hypotheses—a number sufficiently small as to limit the leeway for selective presentation of results downstream—18% specified between six and ten hypotheses; 18% specified between 11 and 20 hypotheses; 21% specified between 21 and 50 hypotheses; and 8% specified more than 50 hypotheses…PAPs that pre-specify so many hypotheses raise questions about the value of pre-registration.”
“Taken together, these practices leave significant leeway for authors to omit results that are null or that complicate the story they wish to tell. But do authors take advantage of this latitude in practice?”
“To find out, we examined the sub-sample of 93 PAPs we coded that had publicly available papers and compared the primary hypotheses pre-specified in the PAP with the hypotheses discussed in the paper and/or its appendices. We find that study authors faithfully presented the results of all their pre-registered primary hypotheses in their paper or its appendices in just 61% of cases.”
“We found that 18% of the papers in our sample presented tests of novel hypotheses that were not pre-registered…authors that presented results based on hypotheses that were not pre-registered failed to mention this in 82% of cases.”
“Foremost among the objections to PAPs is that they are too time-consuming to prepare. Eighty-eight percent of researchers in our PAP users’ survey reported devoting a week or more to writing the PAP for a typical project, with 32% reporting spending an average of 2-4 weeks and 26% reporting spending more than a month.”
“However, while the PAP users we surveyed nearly all agreed that writing a PAP was costly, 64% agreed with the statement that ‘it takes a considerable amount of time, but it is worth it.’”
“Our stocktaking suggests that PAPs, as they are currently written and used, are not doing everything their proponents had hoped for…The details of the analyses that PAPs pre-specify…are often inadequate to reduce researcher degrees of freedom in a meaningful way.”
“In addition, papers that result from pre-registered analyses do not always follow them. Some papers introduce entirely novel hypotheses; others present only a subset of the hypotheses that were pre-registered.”
“However, while many of the PAPs we analyzed fell short of the ideal, a majority were sufficiently clear, precise and comprehensive to substantially limit the scope for fishing and post-hoc hypothesis adjustment.”
“So, even if improvements in research credibility do not come from every PAP, the growing adoption of PAPs in Political Science and Economics has almost certainly increased the number of credible studies in these fields.”
To read the article, click here.
[Excerpts taken from the article “E.P.A. to Limit Science Used to Write Public Health Rules” by Lisa Friedman, published in the New York Times]
“The Trump administration is preparing to significantly limit the scientific and medical research that the government can use to determine public health regulations, overriding protests from scientists and physicians who say the new rule would undermine the scientific underpinnings of government policymaking.”
“A new draft of the Environmental Protection Agency proposal, titled Strengthening Transparency in Regulatory Science, would require that scientists disclose all of their raw data, including confidential medical records, before the agency could consider an academic study’s conclusions.”
“E.P.A. officials called the plan a step toward transparency and said the disclosure of raw data would allow conclusions to be verified independently.”
“‘We are committed to the highest quality science,’ Andrew Wheeler, the E.P.A. administrator, told a congressional committee in September. ‘Good science is science that can be replicated and independently validated, science that can hold up to scrutiny.'”
“The measure would make it more difficult to enact new clean air and water rules because many studies detailing the links between pollution and disease rely on personal health information gathered under confidentiality agreements.”
To read the article, click here.
[Excerpts taken from the article “Data sharing practices in randomized trials of addiction interventions” by Matt Vassar, Sam Jellison, Hannah Wendelbo, and Cole Wayant, published in the journal Addictive Behaviors]
“We conducted a 6 year cross-sectional investigation of the rates and methods of data sharing in 15 high-impact addiction journals that publish clinical trials.”
“In the included journals, zero (0/394, 0.0%) RCTs shared their data publicly. The large majority (315/394, 79.9%) of included trials received funding from public sources. Eight journals had data sharing policies…”
“Our finding has significant implications for the addiction research community. These implications are broad, ranging from possibly slowed scientific advancement to noncompliance with obligations to the public whose tax dollars funded a large majority of the included RCTs.”
“To improve the rates of data sharing, we recommend studying incentive systems, while simultaneously working to cultivate a data sharing system that emphasizes scientific, rather than author, accuracy.”
To read the article, click here (NOTE: Article is behind a paywall.)
[Excerpts taken from the preprint, “Preregistration is redundant, at best” by Aba Szollosi et al., posted at PsyArXiv Preprints]
“The key implication argued by proponents of preregistration is that it improves the diagnosticity of statistical tests…In the strong version of this argument, preregistration does this by solving statistical problems, such as family-wise error rates. In the weak version, it nudges people to think more deeply about their theories, methods, and analyses.”
“We argue against both: the diagnosticity of statistical tests depend entirely on how well statistical models map onto underlying theories, and so improving statistical techniques does little to improve theories when the mapping is weak. There is also little reason to expect that preregistration will spontaneously help researchers to develop better theories.”
“Solving statistical problems with preregistration does not compensate for weak theory. Imagine making a random prediction regarding the outcome of an experiment. Should we observe the predicted outcome, we would not regard this “theory” as useful for making subsequent predictions. Why should we regard it as better if it was preregistered?”
“On the other hand…there is nothing inherently problematic about post-hoc scientific inference when theories are strong. The crucial difference is that strong scientific inference requires that post-hoc explanations are tested just as rigorously as ones generated before an experiment — for example, by a collection of post-hoc tests that evaluate the many regularities implied by a novel theory…There is no reason not to take such post-hoc theories seriously just because they were thought of after or were not preregistered before an experiment was conducted.”
“Although preregistration does not require the improvement of theories, many argue that it at least nudges researchers to think more deeply about how to improve their theories. Though this might sometimes be so, there is no clear explanation for why we should expect it to happen.”
“One possible explanation is that researchers are motivated to improve their theories should they encounter problems when preregistering a study or when preregistered predictions are not observed. The problem with this line of argument is that any improvement depends upon a good understanding of how to improve a theory, and preregistration provides no such understanding.”
“Taking preregistration as a measure of scientific excellence can be harmful, because bad theories, methods, and analyses can also be preregistered. Requiring or rewarding the act of preregistration is not worthwhile when its presumed benefits can be achieved without it just as well.”
“…statistical methods are just tools to test implications derived from theory. Therefore, such statistical problems become irrelevant because theories, not random selection, dictate what comparisons are necessary.”
“Issues that prevent criticism of theory, such as poor operationalization, imprecise measurement, and weak connection between theory and statistical methods, need our attention instead of problems with statistical inference.”
To read the article, click here.


You must be logged in to post a comment.