[From the working paper “The Dozen Things Experimental Economists Should Do (More Of)” by Eszter Czibor, David Jimenez-Gomez, and John List, Working Paper 25451 in the NBER Working Paper Series]
“…We believe that the best approach to increasing the reliability of results from experimental economics lies in replication.”
“…Moonesinghe et al. (2007) and Maniadis et al. (2014) demonstrate how a few successful replications can increase the positive predictive value of a finding. This increase is particularly dramatic in cases when prior probabilities are low. Within the same framework, Coffman and Niederle (2015) argue that even the most inaccurate beliefs can be corrected within three to five replications.”
“…Replications typically bring little recognition for their authors despite the substantial work they entail. The process is particularly tedious because data and code for published articles are often unavailable – even though most leading economics journals have introduced data sharing requirements and mandatory data archives, such policies are not necessarily enforced (Hoeffler, 2017).”
“…studies suggest that the natural rate of replication in empirical economics is low, although heavily cited and influential papers do tend to get replicated.”
“… The first systematic evidence of replicability of laboratory experiments in economics is provided by Camerer et al. (2016) …They find a significant effect in the same direction as in the original study in 11 out of the 18 studies, corresponding to a reproducibility rate of 61%. …The authors also compare the replicated effect sizes with the original, and find a mean relative effect size of 65.9%.”
“Another noteworthy replication initiative is the Social Sciences Replication Project, … They find a significant effect in the same direction as the original study for 13 (62%) studies, and the effect size of the replications is on average about 50% of the original effect size (Camerer et al., 2018). Finally, while both of the above-mentioned projects focus on results published in top journals, Maniadis et al.(2017) analyze replication attempts from 150 economic journals, and find a “success rate” of 42.3% among the 85 experimental replication studies in their sample.”
To read the working paper, click here. (NOTE: This paper is behind a paywall.)
The Psychonomic Society has been hosting an interesting blog series on pre-registration. Below are the five blogs with ridiculously brief, and probably misleading, summaries:
Stephen Lindsay (“Arguments for Preregistering Psychology Research”) SUMMARY: Proper interpretation of the results from hypothesis testing require specific, pre-registered tests.
Danielle Navarro (“Prediction, pre-specification and transparency”) SUMMARY: Pre-registration tries to simultaneously satisfy three different goals: to make predictions (i.e., avoiding hindsight bias); to adhere to the statistical assumptions of confirmatory testing; and to provide transparency. Unappreciated is that these different goals require different specifications of pre-registrations. Further, in the case of transparency, pre-registration may not be the best tool for the job.
We should also add to this mix the recent Guest Blog from Nathan Goodman at TRN (“Hold the Bus!”) where he questions what seems like blind faith in pre-registration:
Where is the evidence that pre-registration works? That there are more null results? Is that the correct indicator of good science? Are there, in fact, ANY measurables that will enable us to know that pre-registration is producing better science? Those are good questions to which there have not been a lot of good answers to date.
Category: NEWS & EVENTS
Tags: D. Stephen Lindsay, Danielle Navarro, Hypothesis testing, Iris van Rooij, Klaus Oberauer, Nathan Goodman, Pre-registration, Prediction, Psychonomic Society, Richard Morey, Transparency
[From the article “Groundbreaking deal makes large number of German studies free to public” by Kai Kupferschmidt, published in Science]
“Three years ago, a group of German libraries, universities, and research institutes teamed up to force the three largest scientific publishers to offer an entirely new type of contract. In exchange for an annual lump sum, they wanted a nationwide agreement making papers by German authors free to read around the world, while giving researchers in Germany access to all of the publishers’ online content.”
“Today, after almost 3 years of negotiations, the consortium, named Project DEAL, can finally claim a success: This morning, it signed a deal with Wiley, an academic publisher headquartered in Hoboken, New Jersey.”
“Under the 3-year contract, scientists at more than 700 academic institutions will be able to access all of Wiley’s academic journals back to 1997 and to publish open access in all of Wiley’s journals. The annual fee will be based on the number of papers they publish in Wiley journals—about 10,000 in previous years, says one of the negotiators, physicist Gerard Meijer of the Fritz Haber Institute, a Max Planck Society institute here.”
[From the article, “A funder-imposed data publication requirement seldom inspired data sharing” by Jessica Couture, Rachael Blake, Gavin McDonald, and Colette Ward, published in PLOS One]
“…In this study, we tested the ability to recover data collected under a particular funder-imposed requirement of public availability.”
“…We focused our study on the data-collection of the Exxon Valdez Oil Spill Trustee Council (EVOSTC) funded projects. The EVOSTC was created in 1989 to manage public monetary damages by Exxon Corporation following the Exxon Valdez oil spill in the Gulf of Alaska, and has funded hundreds of research projects since its inception. The EVOSTC requires the public availability of data within one year of data collection for all recipients of their grants, but does not specify archiving methods nor does it provide a specific data publication platform.”
“…EVOSTC grants have funded work conducted by an array of institutional or agency sectors (government entities, private consulting firms, universities, Alaskan native groups) working in a variety of scientific disciplines.”
“…Data were obtained from 81 of the 315 data projects funded from 1989–2010 resulting in recovery of data from 26% of funded projects. Of the 81 projects for which data were recovered, 60 (19% of total, 74% of recovered) provided enough metadata and documentation to create formal archives of the data, while 21 datasets (7% of total) did not include enough information to publish.”
“The team received no data from 234 projects, 23% of which received no reply following outreach and 49% of which lost communication before data were provided.”
“…The low recovery rate (26%) we obtained is similar to published data recovery rates testing journals with reporting requirements (see Wollins 1962 who reported a 24% recovery rate, Wichert et al. 2006 who reported 26%, Savage & Vickers 2009 who reported 10%, Vines et al. 2014 who reported 19%, Stodden et al. 2018 who reported 44% recovery).”
“…The open science movement has developed new technologies and worked to move science for-ward with a culture of data sharing. However, as this study shows, it is still very difficult to obtain data that are required by the funder to be shared.”
To read the article, click here.
“Replicability of findings is at the heart of any empirical science” (Asendorpf, Conner, De Fruyt, et al., 2013, p. 108)
The idea that scientific results should be reliably demonstrable under controlled circumstances has a special status in science. In contrast to our high expectations for replicability, unfortunately, recent reports suggest that only about 36% (Open Science Collaboration, 2015) to 62% (Camerer, Dreber, Holzmeister, et al., 2018) of the results reported in various areas of science are actually reproducible. This is disturbing because researchers and lay persons alike tend to accept published findings as rock solid truth. As Mark Twain reportedly put it,
“It ain’t what you don’t know that gets you into trouble. It’s what you know for sure that just ain’t so.”
Dismay over poor replicability is widespread, with 90% of surveyed researchers reporting that there is at least some replicability crisis in their fields (Baker, 2016).
The theme of this article is that it is important to understand the fundamental statistical issues underlying replicability. When pressed, most researchers will concede that replicability cannot be completely guaranteed when random variability affects study outcomes, as it does in all areas where replicability is a concern. Due to random variability, there is always some probability of getting unrepresentative results in either the original study or its replication, either of which could produce a replication failure.
If a successful replication is only probabilistic, what is its probability? I will show how easily-understood statistical models can be used to answer this question (for a more mathematically in-depth treatment, see Miller & Schwarz, 2011). The results are illuminating for at least two reasons:
1) Knowing what replication probability should be expected on purely statistical grounds helps us calibrate the severity of the replicability problem. If we should expect 99% replication success, then the reported values of 36% to 62% indicate that something has gone seriously wrong. If we should only expect 50% replication success, though, then perhaps low replicability is just another part of the challenge of science.
2) If something has gone wrong, then seeing what kinds of things cause poor replicability would almost certainly help us find ways of addressing the problems.
What is replicability?
To construct a statistical model of replicability, it is first essential to define that term precisely, and many reasonable definitions are possible. I will illustrate the essential issues concerning replicability within the context of the standard hypothesis testing framework shown in Table 1. Parallel issues always arise—though sometimes under different names—in alternative frameworks (see “Concluding comments”).
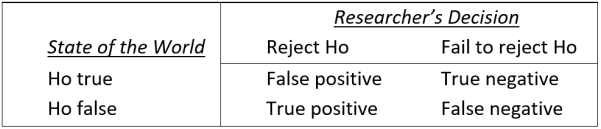 TABLE 1: Standard classification of researchers’ decisions within the hypothesis testing framework. Researchers test a null hypothesis (Ho) which is either true (to an adequate approximation) or false. At the conclusion of the study, either they decide that Ho is false and reject it—a “positive” result, or else they decide that Ho may be true and fail to reject it—a “negative” result. Researchers will sometimes make incorrect decisions (e.g., false positives and false negatives), partly because their results are influenced by random variability.
The great majority of published studies report positive results within the framework of Table 1 (Fanelli, 2012), so it is common to define a successful replication simply as a positive result in study 1 (the initial published finding) followed by a positive result in study 2 (the replication study).
A model for replication probability
To understand the probability of a successful replication as just defined, it is useful to consider what happens across a large number of studies, as is illustrated in Figure 1.
 FIGURE 1. A model for computing the probability of replication. The values in red represent parameters describing the research area for which replication probability is to be computed, and the model illustrates how the replication probability and other values can be computed from these parameters.
Proceeding from left to right across the figure, the model starts with a large set of studies conducted by the researchers in the area for which replication probability is to be determined. In medical research, for example, these might be studies testing different drugs as possible treatments for various diseases. As shown in the next column of the figure, the null hypothesis is approximately true in some studies (i.e., the drug being tested has little or no effect), whereas it is false in others (i.e., the drug works well). In the particular numerical example of this figure, 10% of the studies tested false null hypotheses.
The “Study 1” column of the figure illustrates the results of the initial 1,000 studies. For the 900 studies in which the null was true, there should be about 45 positive results—that is, false positives—based on the standard α=.05 cut-off for statistical significance[1]. For the 100 studies in which the null was false, the number of positive results—that is, true positives—depends on the level of statistical power. Assuming the power level of 60% shown here, there should be about 60 true positives.[2]
It is illuminating—perhaps “alarming” would be a better word—to consider the implications of this model for the veracity of published findings in this research area. Given these values of the three parameters (i.e., α level, power, and base rate of false null hypotheses), publication of all positive findings would mean that 45/105 = 43% of the published findings would be false.
That value, called the “rate of false positives”, is obviously incompatible with the common presumption that published findings represent rock solid truth, but it emerges inevitably from these parameter values. Moreover, these parameter values are not outlandish; α=.05 is absolutely standard, statistical power=.60 is reasonable for many research areas, and so is a base rate of 10% false null hypotheses (e.g., 10% of drugs tested are effective).
Returning to the issue of replicability, the “Study 2” column of the figure shows what happens when researchers try to replicate the findings from the 45+60=105 positive outcomes from Study 1. If the replications use the same levels of α and power, on average only 2.25+36=38.25 replications will be successful. Thus, the expected overall replication probability[3] is 38.25/105=0.36. Again, this value is disturbingly low relative to the expectation that scientific findings should be consistently replicable, despite the fact that the parameter values assumed for this example are not wildly atypical.
It is also worth noting that the low replication probability obtained in Figure 1 results partly from the computation’s exclusive focus on positive results, as dictated by the standard definition of a “successful replication” stated earlier (i.e., a positive result in study 1 followed by a positive result in study 2).
Suppose instead that replication success was defined as getting the same result in Study 2 as in Study 1 (i.e., both studies got positive results or both got negative). To evaluate the probability of replication success under that revised definition, it would also be necessary to repeat each Study 1 that had negative results. If negative results were obtained again in these replication attempts, they would count as a successful replications under the revised definition. The replication probability would now jump to 87% (computations left as an exercise for the reader), which obviously sounds a lot better than the 36% computed under the standard definition.
Replication probability increases under the revised definition mostly because 95% of the 855 true negative Study 1 results would be replicated successfully in Study 2 (i.e., only 5% would produce non-replicating positive effects by chance). There is of course no inherently correct definition of “successful replication”, but it is worth keeping in mind that low replicabilities under the standard definition do not mean that few studies reach correct conclusions—only that many reports of positive findings may be wrong.
Expected replication probabilities with other parameter values
The 36% replication probability in Figure 1 is of course specific to the particular parameter values assumed for that example (i.e., the researchers’ α level, the power of their experiments, and the base rate of false null hypotheses). Using the same model, though, it is possible to compute the expected replication probability over a wide range of parameter values, and the results are illuminating.
Specifically, Figure 2 shows how the expected replication probability depends on the values of these three parameters when Study 2 power is the same as Study 1 power, as would be true in the case of exact replications of the original study, as diagrammed in Figure 1. Figure 3 shows the expected replication probabilities for the slightly different situation in which Study 2 power is much higher than it was in the original study—the Study 2 power value of 0.95 was used in these computations. Replicability with these “high power” replications is of interest because systematic studies of replicability (e.g., the above-cited studies producing the replicability estimates of 36%—62%) often increase sample sizes to obtain much higher power than was present in the original study.
 FIGURE 2. Replication probability, Pr(rep), as a function of α, power, and the base rate of false null hypotheses, computed using the model illustrated in Figure 1.
 FIGURE 3. High-power replication probability, Pr(rep), as a function of α, Study 1 power, and the base rate of false null hypotheses. These Pr(rep) values were computed under the assumption that Study 2 power is 0.95, regardless of Study 1 power.
The most striking finding in Figures 2 and 3 is simply that replication probabilities can be quite low. In each panel of Figure 2, for example, the replication probability is less than or equal to the individual power of each study. The panel’s power is the maximum possible replication probability, because it is the replication probability in the ideal case where there are no false positives. The maximum replication probabilities are much higher in Figure 3, because almost all true positives replicate when Study 2 power is 0.95. Nonetheless, within both figures some of the replication probabilities are far lower than is suggested by the expectation that scientific findings should be completely replicable. The implication is that we must either modify the research practices embodied in Figure 1 or else lower our expectations about the replicability of reported effects (cf. Stanley & Spence, 2014).
Another striking result in Figures 2 and 3 is that replication probability can drop to quite low rates when the base rate of false null hypotheses is low. The reason can be seen in the model of Figure 1. If most studies test true null hypotheses, then most of the positive results will be false positives, and these will be unlikely to replicate. As an extreme example, suppose that 999 of the 1,000 studies tested true null hypotheses. In that case at most one of the positive results could be a true positive. All the rest would necessarily be false positives, and the overall replication rate would necessarily be low. This would be true for any level of power and practically any level of α, so a low base rate of false null hypotheses will virtually always produce low replicability.
The implication, of course, is that one of the best ways to improve replicability is for researchers to avoid looking for “long shot” effects, instead requiring strong theoretical motivation before looking for effects (which, I presume, would increase the base rate). In fact, there are good reasons to believe that the temptation to test for long shots differs across research areas and that the resulting between-area differences in base rates are responsible for some of the between-area differences in replicability that have been reported (Wilson & Wixted, 2018).
Finally, Figures 2 and 3 also show that replication probability increases (a) as the α level decreases (e.g., from α=0.05 to α=0.005), and (b) as statistical power increases. These patterns reinforce calls for researchers to use lower α levels (e.g., Benjamin, Berger, Johannesson, et al., 2018) and to increase power (e.g., Button, Ioannidis, Mokrysz, et al., 2013).
Unfortunately, implementing these changes would be costly. For example, more than three times as much data are needed to run a study with α=0.005 and power=0.8, as compared with a study having α=0.05 and power=0.6. Assuming that data collection resources are limited, researchers would thus face the trade-off of choosing between, say, 10 of the larger studies (with higher replicability) or 30+ of the smaller studies (with lower replicability). This would clearly be a complicated choice that could be influenced by many factors. Using a cost-benefit analysis to quantify these trade-offs, Miller and Ulrich (2016, 2019) examined how researchers could make optimal choices (e.g., of α) to maximize overall scientific payoff, and they found—perhaps surprisingly—that under some circumstances the optimal choices would lead to replication probabilities under 50%.
Concluding comments
My presentation here was based on the de facto standard “null hypothesis testing” framework of statistical analysis shown in Table 1. Since that framework has often been criticized (for a relatively balanced discussion, see Nickerson, 2000—especially the esteemed colleague’s comment in footnote 2), some might wonder, “Could replication probabilities be improved by switching to a different framework (e.g., Bayesian)?”
Answering that question requires a precise formalization of the suggested alternative framework that is comparable to the framework shown in Figure 1, but my sense is that the answer is “no”. Regardless of which statistical criterion is used to decide whether an effect is present, Studies 1 and 2 will sometimes give conflicting results due to random variation. Moreover, there will be close analogs of the base rate, α level, and power parameters within any framework for making inferences about whether effects are present, and these new parameters will have pretty much the same influences on replication probability. For example, if the base rate of true effects is low, more of the seemingly positive Study 1’s effects will be false positives, and these effects will therefore be less replicable.
Thus, random variability in the data is the main factor limiting replicability—not the statistical methods used in their analysis. To be sure, improving the replicability of research is a worthwhile goal, but efforts in this direction should take into account the fundamental statistical limits on what is attainable.
Jeff Miller is Professor of Psychology at Otago University in New Zealand. His email address is miller@psy.otago.ac.nz.
[1] I have assumed that researchers use one-tailed hypothesis tests to simplify the computations. The overall pattern of results is quite similar if two-tailed tests are assumed.
[2] I have also assumed that all studies have the same statistical power to simplify the computations. The overall pattern of results is also quite similar if the indicated power level is the mean power of all studies, with the power levels of individual studies varying randomly—for example, with a beta distribution.
[3] It is reasonable to call this overall value an “aggregate replication probability” (Miller, 2009), because it is the overall probability of replication aggregating across all 105 different studies with initially positive findings. In contrast one might also conceive of an “individual replication probability” that would likely be of more interest to an individual researcher. This researcher, looking at the positive results of a specific Study 1, might ask, “If I repeat this study 100 times, about how often will I get significant results?” For the numerical example in the figure, the answer to that question is “either 5% or 60%, depending on whether the tested null hypothesis was actually false.” Note that no single researcher in this area would expect a long-term replication rate of 36%; instead the 36% value is an average for some researchers whose individual replication rates are 5% and others whose rates are 60%.
References
Asendorpf, J. B., Conner, M., De Fruyt, F., De Houwer, J., Denissen, J. J. A., et al. (2013). Recommendations for increasing replicability in psychology. European Journal of Personality, 27, 108–119. doi: 10.1002/per.1919
Baker, M. (2016). Is there a reproducibility crisis? Nature, 533, 452—454.
Benjamin, D. J., Berger, J. O., Johannesson, M., Nosek., B. A., Wagenmakers, E. J., Berk, R., et al. (2018). Redefine statistical significance. Nature Human Behaviour, 2, 6–10. doi: 10.1038/s41562-017-0189-z
Button, K. S., Ioannidis, J. P. A., Mokrysz, C., Nosek, B. A., Flint, J., Robinson, E. S. J. & Munafò, M. R. (2013). Power failure: Why small sample size undermines the reliability of neuroscience. Nature Reviews Neuroscience, 14(5), 365—376. doi: 10.1038/nrn3475
Camerer, C. F., Dreber, A., Holzmeister, F., Ho, T.-H., Huber, J. et al. (2018). Evaluating the replicability of social science experiments in Nature and Science between 2010 and 2015. Nature Human Behaviour, 2, 637—644. doi: 10.1038/s41562-018-0399-z
Fanelli, D. (2012). Negative results are disappearing from most disciplines and countries. Scientometrics, 90(3), 891—904. doi: 10.1007/s11192-011-0494-7
Miller, J. O. (2009). What is the probability of replicating a significant effect? Psychonomic Bulletin & Review, 16(4), 617—640. doi: 10.3758/PBR.16.4.617
Miller, J. O. & Schwarz, W. (2011). Aggregate and individual replication probability within an explicit model of the research process. Psychological Methods, 16(3), 337—360. doi: 10.1037/a0023347
Miller, J. O. & Ulrich, R. (2016). Optimizing research payoff. Perspectives on Psychological Science, 11 (5), 664—691. doi: 10.1177/1745691616649170
Miller, J. O. & Ulrich, R. (2019). The quest for an optimal alpha. PLOS ONE, 14 (1), 1—13. doi: 10.1371/journal.pone.0208631
Nickerson, R. S. (2000). Null hypothesis significance testing: A review of an old and continuing controversy. Psychological Methods, 5, 241—301. doi: 10.1037/1082-989X.5.2.241
Open Science Collaboration (2015). Estimating the reproducibility of psychological science. Science, 349(6251), aac4716-1—aac4716-8. doi: 10.1126/science.aac4716
Stanley, D. J. & Spence, J. R. (2014). Expectations for replications: Are yours realistic? Perspectives on Psychological Science, 9(3), 305—318. doi: 10.1177/1745691614528518
Wilson, B. M. & Wixted, J. T. (2018). The prior odds of testing a true effect in cognitive and social psychology. Advances in Methods and Practices in Psychological Science, 1 (2), 186—197. doi: 10.1177/2515245918767122
There are many debates about the definitions and distinctions for replication research, particularly for internal replication research, which is conducted using the original dataset from an article or study. The debaters are concerned about what kinds of replication exercises are appropriate and about how (and whether) to make determinations of “success” and “failure” for a replication.
What everyone seems to agree, however, is that the most basic test – the lowest bar for any publication to achieve – is that a third party can take the authors’ software code and data and apply the code to the data to reproduce the findings in the published article. This kind of verification should be a no-brainer, right? But it turns out, as reported in a newly published article in PLOS ONE, only 25% of the articles Benjamin D.K. Wood, Rui Müller, and I tested met this bar. Only 25% are verifiable!
I suspect (hope) that this finding raises a lot of questions in your mind, so let me try to answer them.
Why did you test this?
We embarked on the push button replication exercise in 2015 when Ben and I were still at the International Initiative for Impact Evaluation (3ie) running its replication program(me). At a consultation event we hosted, the discussion turned to the question of whether we should believe that published articles can all be replicated in this way. Some argued of course we should, but others maintained that we cannot take for granted that published articles are supported by clean data and code that easily reproduce the tables and graphs. So we decided to test it.
In our quest to use replication terms that are self-explanatory (see here for other examples) we decided to call it push button replication – you can push a button to replicate the findings presented in the tables and figures in a published study. As children of the Midwest United States, we also thought the PBR acronym was fun.
How did you test this?
We started by selecting a sample of articles to test. Our work at 3ie revolved around development impact evaluations, so we focused on these types of studies. One advantage of studying research within this set is that the studies use similar quantitative methods, but span many sectors and academic disciplines. We used the records in 3ie’s Impact Evaluation Repository for the period 2010 to 2012 to identify the top ten journals publishing development impact evaluations. Then we screened all the articles published in those ten journals in 2014 for those that qualified as development impact evaluations. We ended up with a sample of 109 articles.
That was the easy part. We also developed a detailed protocol for conducting a push button replication. The protocol outlines very clear procedures for requesting data and code, pushing the button, and selecting a classification. We piloted and then revised the protocol a few times before finalizing it for the project. We also created a project in the Open Science Framework (OSF) and posted the protocol and other project documents there for transparency.
To be clear, the journals in our sample had different replication data requirements in 2014. One journal required public replication files, and two others required that replication files be made available upon request. The rest had no requirements. We decided at the beginning that we did not just want to look for publicly available files as other studies like ours have done. We wanted to observe first whether the requirements that do exist are working and second whether articles in journals without any requirements are third-party verifiable. We have witnessed many researchers who are ahead of the journals in adopting research transparency practices, so we were hopeful that authors would hold themselves to a verifiability standard even if their journal did not require them to do so.
With the sample and the protocol in hand, we set out to attempt push button replications for each article. At this point Rui joined the team and offered to take on all the economics impact evaluations in the sample as part of his master’s thesis.
What did you find?
We present the primary results in Figure 1 in the paper, which is copied below. For the majority of the articles in the sample (59 out of 109) the authors refused to provide the data and code for verification. They just said no. Even some who stated in their articles that replication data would be provided upon request just said no when we made that request. And even some who published in journals requiring that replication files be provided just said no. Not just some, a lot. The authors of ten of 20 articles from the Journal of Development Economics and 24 of 34 articles from PLOS ONE, both journals with requirements for providing replication files, refused to provide data and code for verification.
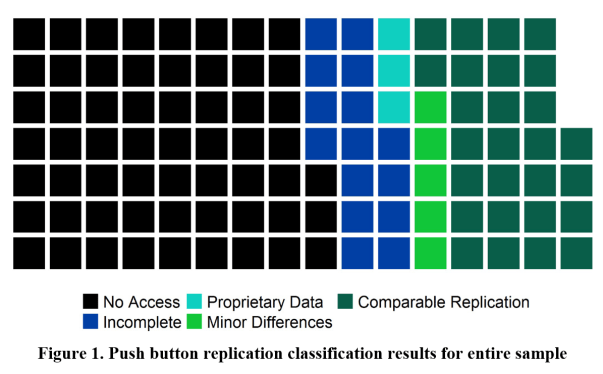
But, you say, some of those data must be proprietary! Yes, some of the authors claimed that, but they needed to prove it to be classified as proprietary data. We rejected six unsubstantiated claims but did classify the three substantiated claims as having propriety data (the turquoise squares).
You might be saying to yourself, “why would authors give access to their code and data if they didn’t know what you were going to do with them?” But they did. The push button replication protocol and the description of our project were publicly available, and we offered to sign whatever kind of confidentiality agreement regarding the data was necessary. You might also be objecting that we didn’t give them enough chances or enough time. But we far exceeded our stated protocol in terms of the number of reminders we sent and the length of time we waited. In fact, we would have accepted any replication files that came in before we finalized the results, so authors really had from our first request in 2016 until we finalized the results early in 2018 to provide the data.
We did receive data for 47 articles. For 15 of these, we received data and code but not enough to fully reproduce the tables and figures in the published articles. These are classified as incomplete (the royal blue squares). For the rest, the news is good. Of the 32 articles that we were able to push button replicate, 27 had comparable findings. Five had some minor differences, especially when focusing on the tables tied to the articles’ key results.
Do these findings matter?
You might look at the figure and conclude, “only five complete push button replications found minor differences”, so that’s good news! Well, yes, but I see this this way: for twenty of the 47 articles for which we received data, we know that the authors’ data and code cannot completely or comparably reproduce the published findings. That’s 43%. Is there any reason to believe that the rate is lower for those articles for which the authors refused to provide the files? I don’t think so. If anything, one might hypothesize the opposite.
Our conclusion is that much of the evidence that we want to use for international development, evidence from both the health sciences and the social sciences, is not third-party verifiable. In the PLOS ONE article, we present additional results, including the classifications by each of the ten journals and the results according to some of the funders of these studies.
What do you recommend?
First, unfortunately, it is not enough for a journal to simply have a policy. Many academics do not respect policies that the journals do not enforce. The exception to this in our sample was American Economic Journal: Applied Economics. It had an upon-request policy, and we received the data and code for six out of eight articles, with the other two meeting the requirements to be classified as proprietary data.
Second, many health scientists and social scientists are lagging not just in research transparency practices, but also in good research practices. Even for publications as recent as 2014, many authors did not maintain complete data and code to reproduce their published findings. Fifteen of 47 for which we received files did not have complete files to send. In many fields there are formal and informal associations of researchers who are pushing for better practices, but I believe that sea change will require firm action on the part of journals.
Annette N. Brown, PhD is Principal Economist at FHI 360, where she leads efforts to increase and enhance evidence production and use across all sectors and regions. She previously worked at 3ie, where she directed the research transparency programs, including the replication program.
Category: GUEST BLOGS
Tags: 3ie, 3ie replication programme, Annette N. Brown, Benjamin Wood, FHI 360, Impact evaluation, International development, PLOS ONE, Push button reproducibility, R&E Search for Evidence, replication
[From the article “Intellectual humility: the importance of knowing you might be wrong” by Brian Resnick, published at Vox]
“Julia Rohrer wants to create a radical new culture for social scientists. A personality psychologist at the Max Planck Institute for Human Development, Rohrer is trying to get her peers to publicly, willingly admit it when they are wrong.”
“To do this, she, along with some colleagues, started up something called the Loss of Confidence Project. It’s designed to be an academic safe space for researchers to declare for all to see that they no longer believe in the accuracy of one of their previous findings. The effort recently yielded a paper that includes six admissions of no confidence. And it’s accepting submissions until January 31.”
“…The project is timely because a large number of scientific findings have been disproven, or become more doubtful, in recent years. One high-profile effort to retest 100 psychological experiments found only 40 percent replicated with more rigorous methods. It’s been a painful period for social scientists, who’ve had to deal with failed replications of classic studies and realize their research practices are often weak.”
“…For the past few months, I’ve been talking to many scholars about intellectual humility, the crucial characteristic that allows for admission of wrongness.”
“…I’ve also realized how difficult it is to foster intellectual humility. In my reporting on this, I’ve learned there are three main challenges on the path to humility:”
1) “In order for us to acquire more intellectual humility, we all, even the smartest among us, need to better appreciate our cognitive blind spots. Our minds are more imperfect and imprecise than we’d often like to admit. Our ignorance can be invisible.”
2) “Even when we overcome that immense challenge and figure out our errors, we need to remember we won’t necessarily be punished for saying, “I was wrong.” And we need to be braver about saying it. We need a culture that celebrates those words.”
3) “We’ll never achieve perfect intellectual humility. So we need to choose our convictions thoughtfully.”
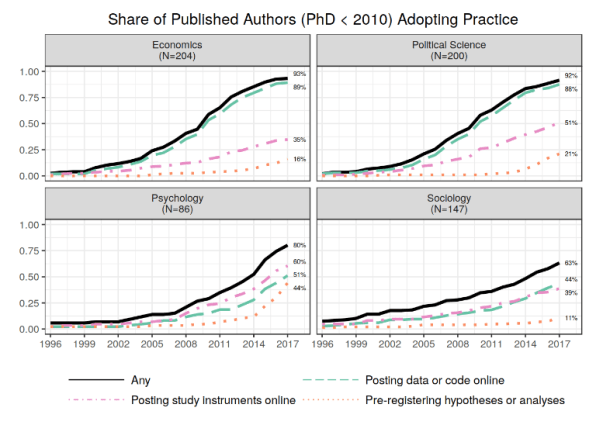
[From a talk by Betsy Levy Paluck entitled “Open Science Practices are on the Rise Across Four Social Science Disciplines”, based on research with co-authors David Birke, Garret Christensen, Rebecca Littman, Ted Miguel, & Zenan Wang, presented at the annual meeting of BITSS]
Paluck’s talk discussed results from a survey given to researchers who recently published in the top journals in their discipline, and PhD students from top North American doctoral programs. There were two parts to the survey: (1) trends in open science practices; and (2) a survey of researchers’ awareness, attitudes and behavior towards (i) posting data and code online, (ii) posting study instruments, and (iii) and pre-registration. This brief summary only addresses the first part.
The following two slides address the question: “Has there been notable movement toward open science practices within the social sciences in recent years?”
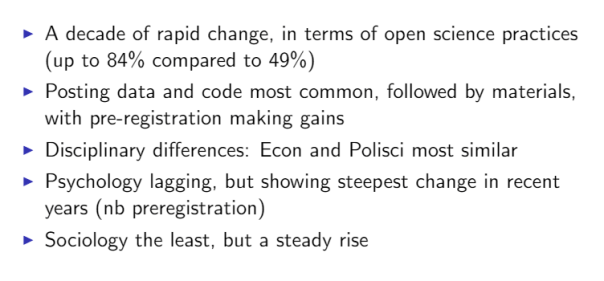
Paluck’s summary of these data is:
To learn more about the second part of the survey, check out the PPT slides (click here) or the YouTube recording of the talk (click here).
[From the blog by David McKenzie, “A few catch-up links”, posted at Development Impact]
“At the BITSS conference, Andrew Foster … gave an update of the JDE’s pilot of registered reports/pre-results review. Some points he noted:”
– “They see this process as potentially encouraging people to take on riskier projects where there are states of the world in which the interventions might not work, or where there is a chance that someone else might scope the paper by doing something similar before you are done – so the insurance function could be useful.”
– “To date they have had 21 submissions, of which 2 have been accepted, 10 rejected (in an average of 6 weeks), and 9 are under review. The main reasons for rejection are i) concerns that a null result will be imprecise or uninformative; ii) power calculations that seem too over-optimistic or insufficiently justified; iii) papers that fail to adequately justify what the contribution is to the literature – making clear that this is not just submitting your pre-analysis plan, but working hard as to make clear why we should care about the answer; and iv) not providing sufficient detail on research design.”
– “He noted a couple of things that differ from registered reports in psychology and other sciences are i) the much longer timelines of many econ studies and all the associated implementation issues and delays outside the controls of researchers this brings; and ii) that researchers may want to avoid too much publicity about ongoing studies – something I have previously blogged about, and which I am pleased the JDE is being sensitive too.”
– “He reiterated that they see this being of particular usefulness in helping young researchers, and that they do not want to close the door to people taking accepted stage 1 proposals and trying top general interest journals with the paper first (but they may at some point put a statute of limitations on how long you have to do this).”
– “They will make clearer going forward that they will only consider papers in which at most baseline data has been collected at the time of submission – in the early stages they have had some submissions where data are being collected but not yet analyzed.”
To see Andrew Foster’s Power Point presentation from the BITSS conference, click here.
[From the article “Sometimes a failure to replicate a study isn’t a failure at all” by Bethany Brookshire, published in Scicurious]
“As anyone who has ever tried a diet knows, exerting willpower can be exhausting. After a whole day spent carefully avoiding the snack machine and attempting to take mindful joy in plain baked chicken and celery sticks, the siren call of cookies after dinner may be just too much to bear. This idea — that exercising self-control gets harder the more you have to do it — is called ego depletion, and it’s one of the most well-known concepts in social psychology. There are popular books on it. Most of us have probably have personal experience with it.”
“But what if a huge study of thousands of people found no evidence for ego depletion? What if some cultures actually show reverse ego depletion — where exerting willpower actually makes exerting more willpower easier? What if I told you that ego depletion does exist — but only if you believe it does?”
“…This idea — that sometimes it happens, sometimes it doesn’t — isn’t particularly satisfying. Most of us were taught that, in science, a scientist forms a hypothesis, tests it and then throws it out if it doesn’t work. That’s what the philosopher of science Karl Popper thought, says Janet Stemwedel, herself a philosopher of science at San Jose State University in California. In this view, scientists go out every day and “throw hypotheses in the deep end of the pool to see if they can swim.” By Popper’s standards, if ego depletion fails to replicate, it’s a failed hypothesis. It deserves to drown.”
“But there are other less hypothesis-drowning ideas of how science should work. Thomas Kuhn, for example, was a little more flexible. In Kuhn’s view, scientists don’t attempt to falsify a hypothesis. Instead, they work with it, seeing how many ways a hypothesis can explain things that happen in the world, Stemwedel explains. Once scientists can’t solve problems with that paradigm, it’s time to find a new one. In this view, not finding ego depletion in a particular context doesn’t mean it’s time to let it sink. It means it’s time to find new ways to look at the concept.”

You must be logged in to post a comment.