The Replication Network
Furthering the Practice of Replication in Economics
Does Peer Review Ensure Scientific Integrity? Should it? Can it?
[From the article “The changing forms and expectations of peer review” by Serge Horbach and Willem Halffman, published in Research Integrity and Peer Review, 2018, 3:8]
This is a wonderful article that provides a comprehensive discussion of peer review in the context of scientific quality and integrity. Here are some highlights from the article.
– Provides context for arguments around the role of peer review in ensuring scientific quality/integrity. This includes references from those arguing that it performs that function adequately, to others that argue it fails miserably.
– It discusses the historical evolution of peer-review, arguing that it did not become a mainstream journal practice until after the Second World War.
– Explains how the desire to ensure fairness and objectivity led to single-blind, double-blind, and triple-blind reviewing (where even the handling editor does not know the identify of the author). See table below:
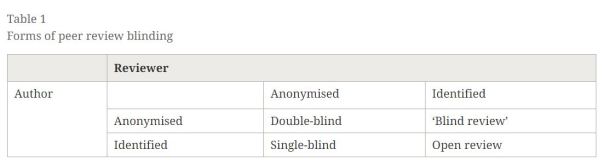
– Discusses the evidence for bias (particularly gender and institutional-affiliation bias) in peer review.
– It is interesting that the same concern for reviewer bias has led to diametrically opposite forms of peer review: double-blind peer review and open peer review.
– With the advent of extra-journal publication outlets, such as pre-print archives, there has been discussion that peer review should serve less the role of quality assurance, and more the goal of providing context and connection to existing literature.
– Makes the argument that one of the motivations behind “registered reports”, where journals decide to publish a paper based on its research design — independently of its results — is that this would provide a greater incentive to undertake replications.
– Related to the replication crisis and publication bias, peer review at some journals has moved to re-focussing assessment away from novelty and statistical significance, and towards importance of the research question and soundness of research design.
– Another development in peer review has been the creation of software to assist journals and reviewers in identifying plagiarism and to detect statistical errors and irregularities.
– Artificial intelligence is being looked to in order to address the burdensome task of reviewing ever-increasing numbers of scientific manuscripts. The following quote offers an intriguing look at a possible, AI future of peer review: “Chedwich deVoss, the director of StatReviewer, even claims: ‘In the not-too-distant future, these budding technologies will blossom into extremely powerful tools that will make many of the things we struggle with today seem trivial. In the future, software will be able to complete subject-oriented review of manuscripts. […] this would enable a fully automated publishing process – including the decision to publish.’”
– Given the increasingly important role that statistics play in scientific research, there is an incipient movement for journals to employ statistical experts to review manuscripts, including the contracting of reviewing to commercial providers.
– Post-publication review, such as that offered by PubPeer, has also expanded peer review outside the decision to publish research.
– Another movement in peer review has been to introduce interactive discussion between the reviewer, the author, and external “peers” before the editor makes their decision. Though this is not mentioned in the article, this is the model of peer review in place at the journal Economics: The Open Access, Open Assessment E-journal.
– The article concludes the discussion by noting that as academic publishing has become big business, with high submission and subscription fees charged to authors and readers, there is an increasing sense that academic publishers should be held responsible for the quality of their product. This has — and will have even more so in the future — consequences for peer review.
To read the full article, click here.
Top Political Science Journal Introduces Results-Free Peer Review
The Journal of Experimental Political Science (JEPS) just announced that is opening up a new kind of manuscript submission based on preregistered reports. Here is how they describe it:
“A preregistered report is like any other research paper in many respects. It offers a specific research question, summarizes the scholarly conversation in which the question is embedded, explicates the theoretically grounded hypotheses that offer a partial answer to the research question, and details the research design for testing the proposed hypotheses. It differs from most research papers in that a preregistered report stops here. The researchers do not take the next step of reporting results from the data they collected. Instead, they preregister the design in a third-party archive, such as the Open Science Framework, before collecting data.”
“At JEPS, we will send out preregistered reports for a review, just like other manuscripts, but we will ask reviewers to focus on whether the research question, theory, and design are sound. If the researchers carried out the proposed research a) would they make a contribution and b) would their proposed test do the job? If the answer is yes (potentially after a round of revisions), we will conditionally accept the paper and give the researchers a reasonable amount of time to conduct the study, write up the results, and resubmit the revised fully-fledged paper. At this point, we will seek the reviewers’ advice one more time and ask, “Did the researchers do what they said they were going to do?” If the answer is “yes,” we will publish the paper. It doesn’t matter if the research produced unexpected results, null findings, or inconsistent findings. In fact, we will specifically instruct reviewers at the second stage to ignore statistical significance and whether they support the authors’ hypotheses when evaluating the paper.”
This follows the recent announcement at another Cambridge University Press journal, the Japanese Journal of Political Science, that it is introducing results-free peer review (RFPR).
To read more about the JEPS announcement, click here.
To read previous posts about RFPR at TRN, click here, here, here, and here.
IN THE NEWS: Mother Jones (September 25, 2018)
[From the article, “This Cornell Food Researcher Has Had 13 Papers Retracted. How Were They Published in the First Place?” by Kiera Butler, published in Mother Jones]
“In 2015, I wrote a profile of Brian Wansink, a Cornell University behavioral science researcher who seemed to have it all: a high-profile lab at an elite university, more than 200 scientific studies to his name, a high-up government appointment, and a best-selling book.”
“…In January 2017, a team of researchers reviewed four of [Wansink’s] published papers and turned up 150 inconsistencies. Since then, in a slowly unfolding scandal, Wansink’s data, methods, and integrity have been publicly called into question. Last week, the Journal of the American Medical Association (JAMA) retracted six articles he co-authored. To date, a whopping 13 Wansink studies have been retracted.”
“… when I first learned of the criticisms of his work, I chalked it up to academic infighting and expected the storm to blow over. But as the scandal snowballed, the seriousness of the problems grew impossible to ignore. I began to feel foolish for having called attention to science that, however fun and interesting, has turned out to be so thin. Were there warning signs I missed? Maybe. But I wasn’t alone. Wansink’s work has been featured in countless major news outlets—the New York Times has called it “brilliantly mischievous.” And when Wansink was named head of the USDA in 2007, the popular nutrition writer Marion Nestle deemed it a “brilliant appointment.””
“Scientists bought it as well. Wansink’s studies made it through peer review hundreds of times—often at journals that are considered some of the most prestigious and rigorous in their fields. The federal government didn’t look too closely, either: The USDA based its 2010 dietary guidelines, in part, on Wansink’s work. So how did this happen?”
To read more, click here.
GOODMAN: Systematic Replication May Make Many Mistakes
Replication seems a sensible way to assess whether a scientific result is right. The intuition is clear: if a result is right, you should get a significant result when repeating the work; if it it’s wrong, the result should be non-significant. I test this intuition across a range of conditions using simulation. For exact replications, the intuition is dead on, but when replicas diverge from the original studies, error rates increase rapidly. Even for the exact case, false negative rates are high for small effects unless the samples are large. These results bode ill for large, systematic replication efforts, which typically prioritize uniformity over fidelity and limit sample sizes to run lots of studies at reasonable cost.
INTRODUCTION
The basic replication rationale goes something like this: (1) many published papers are wrong; (2) this is a serious problem the community must fix; and (3) systematic replication is an effective solution. (In recent months, I’ve seen an uptick in pre-registration as another solution. That’s a topic for another day.) In this post, I focus on the third point and ask: viewed as a statistical test, how well does systematic replication work; how well does it tell the difference between valid and invalid results?
By “systematic replication” I mean projects like Many Lab, Reproducibility Project: Psychology (RPP), Experimental Economics Replication Project (EERP), and Social Sciences Replication Project (SSRP) that systematically select studies in a particular field and repeat them in a uniform fashion. The main publications for these projects are Many Lab, RPP, EERP, SSRP.
I consider a basic replication scheme in which each original study is repeated once. This is like RPP and EERP, but unlike Many Lab as published which repeated each study 36 times and SSRP which used a two-stage replication strategy. I imagine that the replicators are trying to closely match the original study (direct replication) while doing the replications in a uniform fashion for cost and logistical reasons.
My test for replication success is the same as SSRP (what they call the statistical significance criterion): a replication succeeds if the replica has a significant effect in the same direction as the original.
A replication is exact if the two studies are sampling the same population. This is an obvious replication scenario. You have a study you think may be wrong; to check it out, you repeat the study, taking care to ensure that the replica closely matches the original. Think cold fusion. A replication is near-exact if the populations differ slightly. This is probably what systematic replication achieves, since the need for uniformity reduces precision.
Significance testing of the replica (more precisely, the statistical significance criterion) works as expected for exact replications, but error rates increase rapidly as the populations diverge. This isn’t surprising when you think about it: we’re using the replica to draw inferences about the original study; it stands to reason this will only work if the two studies are very similar.
Under conditions that may be typical in systematic replication projects, the rate of false positive mistakes calculated in this post ranges from 1-71% and false negative mistakes from 0-85%. This enormous range results from the cumulative effect of multiple unknown, hard-to-estimate parameters.
My results suggest that we should adjust our expectations for systematic replication projects. These projects may make a lot of mistakes; we should take their replication failure rates with a grain of salt.
The software supporting this post is open source and freely available in GitHub.
SCENARIO
The software simulates studies across a range of conditions, combines pairs of studies into pairwise replications, calculates which replications pass the test, and finally computes false positive and false negative rates for conditions of interest.
The studies are simple two group comparisons parameterized by sample size and population effect size dpop (dpop ≥ 0). For each study, I generate two groups of n random numbers. One group comes from a standard normal distribution with mean = 0; the other is standard normal with mean = dpop. I then calculate the p-value from a t-test. When I need to be pedantic, I use the term study set for the ensemble of studies for a given combination of n and dpop.
The program varies n from 20 to 500 and dpop from 0 to 1 with 11 discrete values each (a total of 112 = 121 combinations). It simulates 104 studies for each combination yielding about 1.2 million simulated studies. An important limitation is that all population effect sizes are equally likely within the range studied. I don’t consider publication bias which may make smaller effect sizes more likely, or any prior knowledge of expected effect sizes.
To generate pairwise replications, I consider all (ordered) pairs of study sets. For each pair, the software permutes the studies of each set, then combines the studies row-by-row. This multiplies out to 1212 = 14,641 pairs of study sets and almost 150 million simulated replications. The first study of the pair is the original and the second the replica. I consistently use the suffixes 1 and 2 to denote the original and replica respectively.
Four variables parameterize each pairwise replication: n1, n2, d1pop, and d2pop. These are the sample and population effect sizes for the two studies.
After forming the pairwise replications, the program discards replications for which the original study isn’t significant. This reflects the standard practice that non-significant findings aren’t published and thus aren’t candidates for systematic replication.
Next the program determines which replications should pass the replication test and which do pass the test. The ones that should pass are ones where the original study is a true positive, i.e., d1pop ≠ 0. The ones that do pass are ones where the replica has a significant p-value and effect size in the same direction as the original.
A false positive replication is one where the original study is a false positive (d1pop = 0) yet the replication passes the test. A false negative replication is one where the original study is a true positive (d1pop ≠ 0), yet the replication fails the test. The program calculates false positive and false negative rates (abbr. FPR and FNR) relative to the number of replications in which the original study is significant.
My definition of which replications should pass depends only on the original study. A replication in which the original study is a false positive and the replica study a true positive counts as a false positive replication. This makes sense if the overarching goal is to validate the original study. If the goal were to test the result of the original study rather than the study itself, it would make sense to count this case as correct.
To get “mistake rates” I need one more parameter: , the proportion of replications that are true. This is the issue raised in Ioannidis’s famous paper, “Why most published research findings are false” and many other papers and blog posts including one by me. The terminology for “mistake rates” varies by author. I use terminology adapted from Jager and Leek. The replication-wise false positive rate (RWFPR) is the fraction of positive results that are false positives; the replication-wise false negative rate (RWFNR) is the fraction of negative results that are false negatives.
RESULTS
Exact replications
A replication is exact if the two studies are sampling the same population; this means d1pop = d2pop.
Figure 1 shows FPR for n1 = 20 and n2 varying from 50 to 500. The x-axis shows all four parameters using d1, d2 as shorthand for d1pop, d2pop. d1pop = d2pop = 0 throughout because this is the only way to get false positives with exact replications. Figure 2 shows FNR for the same values of n1 and n2 but with d1pop = d2pop ranging from 0.1 to 1.
I mark the conventionally accepted thresholds for false positive and negative error rates (0.05 and 0.2, resp.) as known landmarks to help interpret the results. I do not claim these are the right thresholds for replications.
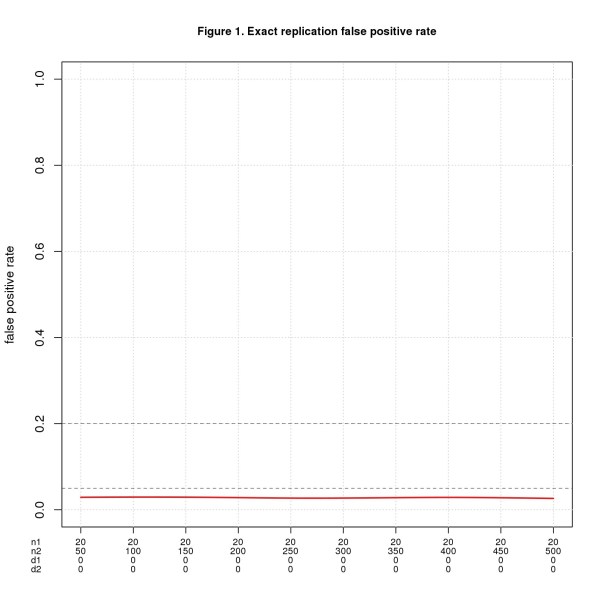

For this ideal case, replication works exactly as intuition predicts. FPR is the significance level divided by 2 (the factor of 2 because the effect sizes must have the same direction). Theory tell us that FNR = 1 – power and though not obvious from the graph, the simulated data agrees well.
As one would expect, if the population effect size is small, n2 must be large to reliably yield a positive result. For d = 0.2, n2 must be almost 400 in theory and 442 in the simulation to achieve FNR = 0.2; to hit FNR = 0.05, n2 must be more than 650 (in theory). These seem like big numbers for a systematic replication project that needs to run many studies.
Near exact replications
A replication is near-exact if the populations differ slightly, which means d1pop and d2pop differ by a small amount, near; technically, abs(d1pop – d2pop) ≤ near.
I don’t know what value of near is reasonable for a systematic replication project. I imagine it varies by research area depending on the technical difficulty of the experiments and the variability of the phenomena. The range 0.1-0.3 feels reasonable. I extend the range by 0.1 on each end just to be safe.
Figure 3 uses the same values of n1, n2, and d1pop as Figure 1, namely n1 = 20, n2 varies from 50 to 500, and d1pop = 0. Figure 4 uses the same values of n1 and n2 as Figure 2 but fixes d1pop = 0.5, a medium effect size. In both figures, d2pop ranges from d1pop – near to d1pop + near with values less than 0 or greater than 1 discarded. I restrict values to the interval [0,1] because that’s the range of d in the simulation.
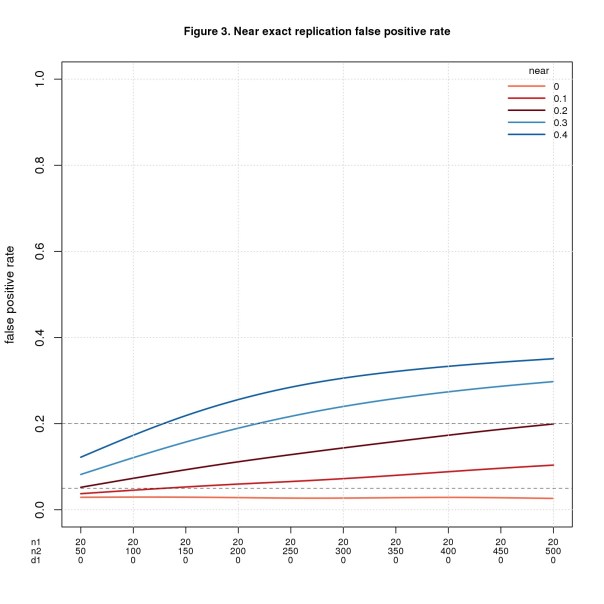

FPR is fine when n2 is small, esp. when near is also small, but gets worse as n2 (and near) increase. It may seem odd that the error rate increases as the sample size increases. What’s going on is a consequence of power. More power is usually good, but in this setting every positive is a false positive, so more power is bad. This odd result is a consequence of how I define correctness. When the original study is a false positive (d1pop = 0) and the replica a true positive (d2pop ≠ 0), I consider the replication to be a false positive. This makes sense if we’re trying to validate the original study. If instead we’re testing the result of the original study, it would make sense to count this case as correct.
FNR behaves in the opposite direction: bad when n2 is small and better as n2 increases.
To show the tradeoff between FPR and FNR, Figure 5 plots both error rates for near = 0.1 and near = 0.3.

For near =0.1, n2 = 150 is a sweet spot with both error rates about 0.05. For near = 0.3, the crossover point is n2 = 137 with error rates of about 0.15.
FNR also depends on d1pop for “true” cases, i.e., when the original study is a true positive, getting worse when d1pop is smaller and better when d1pop is bigger. The table below shows the error rates for a few values of n2, near, and d1pop. Note that FPR only depends on n2 and near, while FNR depends on all three parameters. The FNR columns are for different values of d1pop in true cases.

FNR is great for d1pop = 0.8, mostly fine for d1pop = 0.5, and bad for d1pop = 0.2. Pushing up n2 helps but even when n2 = 450, FNR is probably unacceptable for d1pop = 0.2. Increasing n2 worsens FPR. It seems the crossover point above, n2 = 137, is about right. Rounding up to 150 seems a reasonable rule-of-thumb.
Replication-wise error rates
The error rates reported so far depend on whether the original study is a false or true positive: FPR assumes the original study is a false positive, FNR assumes it’s a true positive. The next step is to convert these into replication-wise error rates: RWFPR and RWFNR. To do so, we need one more parameter: prop.true, the proportion of replications that are true.
Of course, we don’t know the value of prop.true; arguably it’s the most important parameter that systematic replication is trying to estimate. Like near , it probably varies by research field and may also depend on the quality of the investigator. Some authors assume prop.true = 0.5, but I see little evidence to support any particular value. It’s easy enough to run a range of values and see how prop.true affects the error rates.
The table below shows the results for near = 0.1, 0.3 as above, and prop.true ranging from 0.1 to 0.9. The RWFPR and RWFNR columns are for different values of d1pop in “true” cases, i.e., when the original study is a true positive.
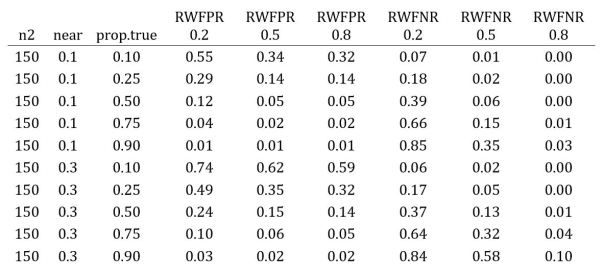
Check out the top and bottom rows. The top row depicts a scenario where most replications are false (prop.true = 0.1) and the replicas closely match the original studies (near = 0.1); for this case, most positives are mistakes and most negatives are accurate. The bottom row is a case where most replications are true (prop.true = 0.9) and the replicas diverge from the originals (near = 0.3); here most positives are correct and, unless d1pop is large, most negatives are mistakes.
Which scenario is realistic? There are plenty of opinions but scant evidence. Your guess is as good as mine.
DISCUSSION
Systematic replication is a poor statistical test when used to validate published studies. Replication works well when care is taken to ensure the replica closely matches the original study. This is the norm in focused, one-off replication studies aiming to confirm or refute a single finding. It seems unrealistic in systematic replication projects, which typically prioritize uniformity over fidelity to run lots of studies at reasonable cost. If the studies differ, as they almost certainly must in systematic projects, mistake rates grow and may be unacceptably high under many conditions.
My conclusions depend on the definition of replication correctness, i.e., which replications should pass. The definition I use in this post depends only on the original study: a replication should pass if the original study is a true positive; the replica study is just a proxy for the original one. This makes sense if the goal is to validate the original study. If the goal were to test the result of the original study rather than the study itself, it would make sense to let true positive replicas count as true positive replications. That would greatly reduce the false positive rates I report.
My conclusions also depend on details of the simulation. An important caveat is that population effect sizes are uniformly distributed across the range studied. I don’t consider publication bias which may make smaller effect sizes more likely, or any prior knowledge of expected effect sizes. Also, in the near exact case, I assume that replica effect sizes can be smaller or larger than the original effect sizes; many investigators believe that replica effect sizes are usually smaller.
My results suggest that systematic replication is unsuitable for validating existing studies. An alternative is to switch gears and focus on generalizability. This would change the mindset of replication researchers more than the actual work. Instead of trying to refute a study, you would assume the study is correct within the limited setting of the original investigation and try to extend it to other settings. The scientific challenge would become defining good “other settings” – presumably there are many sensible choices — and selecting studies that are a good fit for each. This seems a worthy problem in its own right that would move the field forward no matter how many original studies successfully generalize.
I’ve seen plenty of bad science up close and personal, but in my experience statistics isn’t the main culprit. The big problem I see is faulty research methods. Every scientific field has accepted standard research methods. If the methods are bad, even “good” results are likely to be wrong; the results may be highly replicable but wrong nonetheless.
The quest to root out bad science is noble but ultimately futile. “Quixotic” comes to mind. Powerful economic forces shape the size and make-up of research areas. Inevitably some scientists are better researchers than others. But “Publish or Perish” demands that all scientists publish research papers. Those who can, publish good science; those who can’t, do the best they can.
We will do more good by helping good scientists do good science than by trying to slow down the bad ones. The truly noble quest is to develop tools and techniques that make good scientists more productive. That’s the best way to get more good science into the literature.
Nat Goodman is a retired computer scientist living in Seattle Washington. His working years were split between mainstream CS and bioinformatics and orthogonally between academia and industry. As a retiree, he’s working on whatever interests him, stopping from time-to-time to write papers and posts on aspects that might interest others. He can be contacted at natg@shore.net.
How Many Biases? Let Us Count the Ways
[From the article “Congratulations. Your Study Went Nowhere” by Aaron Carroll, published at http://www.nytimes.com]
“When we think of biases in research, the one that most often makes the news is a researcher’s financial conflict of interest. But another bias, one possibly even more pernicious, is how research is published and used in supporting future work.”
“A recent study in Psychological Medicine examined how four of these types of biases came into play in research on antidepressants.”
“… Publication bias refers to the decision on whether to publish results based on the outcomes found. “
“… Outcome reporting bias refers to writing up only the results in a trial that appear positive, while failing to report those that appear negative.”
“… Spin refers to using language, often in the abstract or summary of the study, to make negative results appear positive.”
“… Research becomes amplified by citation in future papers. The more it’s discussed, the more it’s disseminated both in future work and in practice. Positive studies were cited three times more than negative studies. This is citation bias.”
To read more, click here.
18,000 Retractions?
[From the video, “The Retraction Watch Database” by Ivan Oransky, posted at YouTube].
Ivan Oransky, MD, co-founder of the website Retraction Watch gave a talk at the Joint Roadmap for Open Science Tools Workshop at Berkeley in August. In this short video, Oranksy talks about how retracted papers continue to be cited after they have been retracted. 40% of the time when a retracted paper has been cited, there is no acknowledgment that the paper has been retracted (likely because the citing author did not know). And then there’s this:
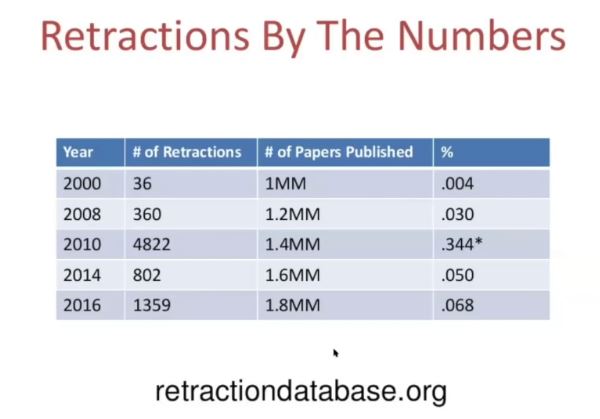
To watch the full video (it’s only about 8 and a half minutes long), click here.
M Is For Pizza
[From the blog ““Tweeking”: The big problem is not where you think it is” by Andrew Gelman, posted at Statistical Modeling, Causal Inference, and Social Science]
“In her recent article about pizzagate, Stephanie Lee included this hilarious email from Brian Wansink, the self-styled “world-renowned eating behavior expert for over 25 years”:

“OK, what grabs your attention is that last bit about “tweeking” the data to manipulate the p-value, where Wansink is proposing research misconduct (from NIH: “Falsification: Manipulating research materials, equipment, or processes, or changing or omitting data or results such that the research is not accurately represented in the research record”).”
“But I want to focus on a different bit: “. . . although the stickers increase apple selection by 71% . . .””
“This is the type M (magnitude) error problem—familiar now to us, but not so familiar a few years ago to Brian Wansink, James Heckman, and other prolific researchers.”
To read more, click here.
IN THE NEWS: Bloomberg (September 18, 2018)
[From the article “Why Economics Is Having a Replication Crisis” by Noah Smith, published at http://www.bloomberg.com]
“By now, most people have heard of the replication crisis in psychology. When researchers try to recreate the experiments that led to published findings, only slightly more than half of the results tend to turn out the same as before. Biology and medicine are probably riddled with similar issues.”
“But what about economics? Experimental econ is akin to psychology, and has similar issues. But most of the economics research you read about doesn’t involve experiments — it’s empirical, meaning it relies on gathering data from the real world and analyzing it statistically. Statistical calculations suggest that there are probably a lot of unreliable empirical results getting published and publicized.”
“…That doesn’t mean that single results aren’t worth reporting or taking into account, but a single finding shouldn’t be enough to generate certainty about how the world works. In a universe filled with uncertainty, social science can’t progress by leaps and bounds — it must crawl forward, feeling its way inch by inch toward a little more truth.”
To read more, click here.


You must be logged in to post a comment.