In a previous post, I argued that lowering α from 0.05 to 0.005, as advocated by Benjamin et al. (2017) – henceforth B72 for the 72 coauthors on the paper, would do little to improve science’s reproducibility problem. Among other things, B72 argue that reducing α to 0.005 would reduce the “false positive rate” (FPR). A lower FPR would make it more likely that significant estimates in the literature represented real results. This, in turn, should result in a higher rate of reproducibility, directly addressing science’s reproducibility crisis. However, B72’s analysis ignores the role of publication bias; i.e., the preference of journals and researchers to report statistically significant results. As my previous post demonstrated, incorporating reasonable parameters for publication bias nullifies the FPR benefits of reducing α.
What, then, can be done to improve reproducibility? In this post, I return to B72’s FPR framework to demonstrate that replications offer much promise. In fact, a single replication has a sizeable effect on the FPR over a wide variety of parameter values.
Let α and β represent the rates of Type I and Type II error associated with a 5 percent significance level, with Power accordingly being given by (1-β). Let ϕ be the prior probability that H0 is true. Consider a large number of “similar” studies, all exploring possible relationships between different x’s and y’s. Some of these relationships will really exist in the population, and some will not. ϕ is the probability that a randomly chosen study estimates a relationship where none really exists. ϕ is usefully transformed to Prior Odds, defined as Pr(H1)/Pr(H0) = (1- ϕ)/ϕ, where H1 and H0 correspond to the hypotheses that a real relationship exists and does not exist, respectively. B72 posit the following range of Prior Odds values as plausible for real-life research scenarios: (i) 1:40, (ii) 1:10, and (iii) 1:5.
We are now in position to define the False Positive Rate. Let ϕα be the probability that no relationship exists but Type I error nevertheless produces a significant finding. Let (1-ϕ)(1-β) be the probability that a relationship exists and the study has sufficient power to identify it. The percent of significant estimates in published studies for which there is no underlying, real relationship is thus given by
(1) False Positive Rate(FPR) = ϕα / [ϕα +(1-ϕ)(1-β)] .
Table 1 reports FPR values for different Prior Odds and Power values when α = 0.05. The FPR values in the table range from 0.24 to 0.91. For example, given 1:10 odds that a studied effect is real, and assuming studies have Power equal to 0.50 – the same Power value that Christensen and Miguel (2017) assume in their analysis – the probability that a statistically significant finding is really a false positive is 50%. Alternatively, if we take a Power value of 0.20, which is about equal to the value that Ioannidis et al. (2017) report as the median value for empirical research in economics, the FPR rises to 71%.
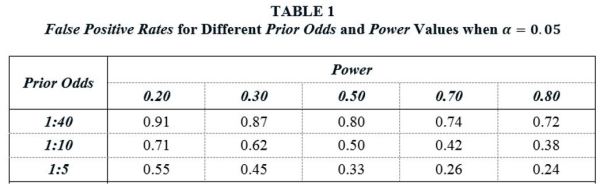
Table 1 illustrates the reproducibility problem highlighted by B72. The combination of (i) many thousands of researchers searching for significant relationships, (ii) relatively small odds that any given study is estimating a relationship that really exists, and (iii) a 5% Type I error rate, results in the published literature reporting a large number of false positives, even without adding in publication bias. In particular, for reasonable parameter values, it is very plausible that over half of all published, statistically significant estimates represent null effects.
I use this framework to show what a difference a single replication can make. The FPR values in Table 1 present the updated probabilities (starting from ϕ) that an estimated relationship represents a true null effect after an original study is published that reports a significant finding. I call these “Initial FPR” values. Replication allows a further updating, with the new, updated probabilities depending on whether the replication is successful or unsucessful. These new, updated probabilities are given below.
(2a) Updated FPR(Replication Successful) ) = InitialFPR∙α / [InitialFPR∙α +(1-InitialFPR)∙(1-β)] .
(2b) Updated FPR(Replication Unsuccessful) ) = InitiailFPR∙(1-α) / [InitialFPR∙(1-α) +(1-InitialFPR)∙β] .
Table 2 reports the Updated FPR values, depending on whether a replication is successful or unsuccessful, with Initial FPR values roughly based on the values in Table 1. Note that Power refers to the power of the replication studies.
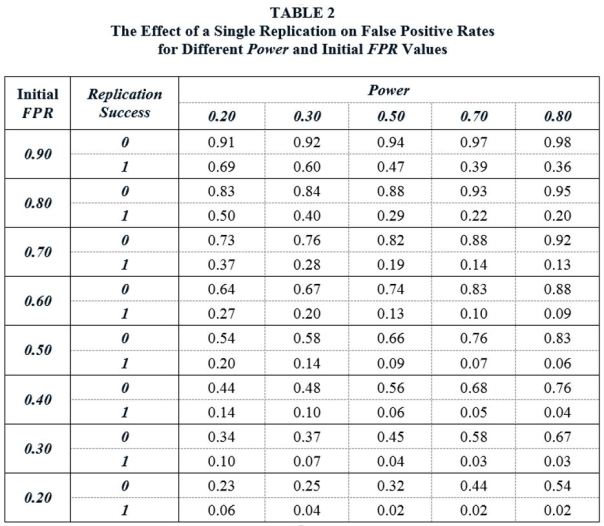
The Updated FPR values show what a difference a single replication can make. Suppose that the Initial FPR following the publication of a significant finding in the literature is 50%. A replication study is conducted using independent data drawn from the same population. If we assume the replication study has Power equal to 0.50, and if the replication fails to reproduce the significant finding of the original study, the FPR increases from 50% to 66%. However, if the replication study successfully replicates the original study, the FPR falls to 9%. In other words, following the replication, there is now a 91% probability that the finding represent a real effect in the population.
Table 2 demonstrates that replications have a sizeable effect on FPRs across a wide range of Power and Initial FPR values. In some cases, the effect is dramatic. For example, consider the case (Initial FPR = 0.80, Power = 0.80). In this case, a single, successful replication lowers the false positive rate from 80% to 20%. As would be expected, the effects are largest for high-powered replication studies. But the effects are sizeable even when replication studies have relatively low power. For example, given (Initial FPR = 0.80, Power = 0.20), a successful replication lowers the FPR from 80% to 50%.
Up to now, we have ignored the role of publication bias. As noted above, publication bias greatly affects the FPR analysis of B72. One might similarly ask how publication bias affects the analysis above. If we assume that publication bias is, in the words of Maniadis et al. (2017) “adversarial” – that is, the journals are more likely to publish a replication study if it can be shown to refute an original study – then it turns out that publication bias has virtually no effect on the values in Table 2.
This is most easily seen if we introduce publication bias to Equation (2a) above. Following Maniadis et al. (2017), let ω represent the decreased probability that a replication study reports a significant finding due to adversarial publication bias. Then if the probability of obtaining a significant finding given no real effect is InitialFPR∙α in the absence of publication bias, the associated probability with publication bias will be InitialFPR∙α∙(1-ω). Likewise, if the probability of obtaining a significant finding when a real effect exists is (1-InitialFPR)∙(1-β) in the absence of publication bias, the associated probability with publication bias will be (1-InitialFPR)∙(1-β)∙(1-ω). It follows that the Updated FPR from a successful replication given adversarial publication bias is given by
(3) Updated FPR(Replication Successful|Adversarial Publication Bias) = FPR∙α∙(1-ω) / [FPR∙α∙(1-ω) +(1-FPR)∙(1-β)∙(1-ω)] .
Note that the publication bias term in Equation (3), (1-ω), cancels out from the numerator and denominator, so that the Updated FPR in the event of a successful replication is unaffected. The calculation for unsuccessful replications is not quite as straightforward, but the result is very similar: the Updated FPR is little changed by the introduction of adversarial publication bias.
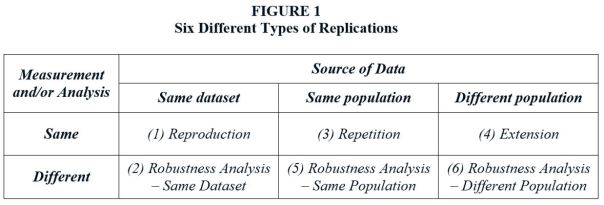
It needs to be pointed out that the analysis above refers to a special type of replication, one which reproduces the experimental conditions (data preparation, analytical procedures, etc.) of the original study, albeit using independent data drawn from an identical population. In fact, there are many types of replications. Figure 1 (see below) from Reed (2017) presents six different types of replications. The analysis above clearly does not apply to some of these.
For example, Power is an irrelevant concept in a Type 1 replication study, since this type of replication (“Reproduction”) is nothing more than a checking exercise to ensure that numbers are correctly calculated and reported. The FPR calculations above are most appropriate for Type 3 replications, where identical procedures are applied to data drawn from the same population as the original study. The further replications deviate from a Type 3 model, the less applicable are the associated FPR values. Even so, the numbers in Table 2 are useful for illustrating the potential for replication to substantially alter the probability that a significant estimate represents a true relationship.
There is much debate about how to improve reproducibility in science. Pre-registration of research, publishing null findings, “badges” for data and code sharing, and results-free review have all received much attention in this debate. All of these deserve support. While replications have also received attention, this has not translated into a dramatic increase in the number of published replication studies (see here). The analysis above suggests that maybe, when it comes to replications, we should take a lead from the title of that country-western classic: “A Little Less Talk And A Lot More Action”.
Of course, all of the above ignores the debate around whether null hypothesis significance testing is an appropriate procedure for determining “replication success.” But that is a topic for another day.
REFERENCES
[From the article, “Progress in Reproducibility” by Jeremy Berg, Editor-in-Chief Science Journals, published in the 5 January 2018 issue of Science]
“Over the past year, we have retracted three papers previously published in Science. The circumstances of these retractions highlight some of the challenges connected to reproducibility policies. In one case, the authors failed to comply with an agreement to post the data underlying their study. Subsequent investigations concluded that one of the authors did not conduct the experiments as described and fabricated data. Here, the lack of compliance with the data-posting policy was associated with a much deeper issue and highlights one of the benefits of policies regarding data transparency. In a second case, some of the authors of a paper requested retraction after they could not reproduce the previously published results. Because all authors of the original paper did not agree with this conclusion, they decided to attempt additional experiments to try to resolve the issues. These reproducibility experiments did not conclusively confirm the original results, and the editors agreed that the paper should be retracted. This case again reveals some of the subtlety associated with reproducibility. In the final case, the authors retracted a paper over extensive and incompletely described variations in image processing. This emphasizes the importance of accurately presented primary data.”
“As this new year moves forward, the editors of Science hope for continued progress toward strong policies and cultural adjustments across research ecosystems that will facilitate greater transparency, research reproducibility, and trust in the robustness and self-correcting nature of scientific results.”
[NOTE: This blog is based on the article “HARKing: How Badly Can Cherry-Picking and Question Trolling Produce Bias in Published Results?” by Kevin Murphy and Herman Aguinis, recently published in the Journal of Business and Psychology.]
The track record for replications in the social sciences is discouraging. There have been several recent papers documenting and commenting on the failure to replicate studies in economics and psychology (Chang & Li, 2015; Open Science Collaboration, 2015; Ortman, 2015; Pashler & Wagenmakers, 2012). This “reproducibility crisis” has simulated a number of excellent methodological papers documenting the many reasons for the failure to replicate (Braver, Thoemmes & Rosenthal, 2014; Maxwell, 2014). In general, this literature has shown that a combination of low levels of statistical power and a continuing reliance on null hypothesis testing have contributed substantially to the apparent failure of many studies to replicate, but there is a lingering suspicion that research misconduct plays a role in the widespread failure to replicate.
Out-and-out fraud in research has been reported in a number of fields; Ben-Yehuda and Oliver-Lumerman (2017) have chronicled nearly 750 cases of research fraud between 1880 and 2010 involving fabrication and falsification of data, misrepresentation of research methods and results and plagiarism. Their work has helped to identify the roles of institutional factors in research fraud (e.g., a large percentage of the cases examined involved externally funded research at elite institutions) as well as identifying ways of detecting and responding to fraud. This type of fraud appears to represent only a small proportion of the studies that are published, and since many of the known frauds have been perpetrated by the same individuals, the proportion of genuinely fraudulent researchers may be even smaller.
A more worrisome possibility is that researcher behaviors that fall short of outright fraud may nevertheless bias the outcomes of published research in ways that will make replication less likely. In particular, there is a good deal of evidence that a significant proportion of researchers engage in behaviors such as HARKing (posing “hypotheses” after the results of a study are known) or p-hacking (combing through or accumulating results until you find statistical significance) (Bedeian, Taylor & Miller, 2010; Head, Holman, Lanfear, Kahn & Jennions, 2015; John, Loewenstein & Prelec, 2012). These practices have the potential to bias results because they involve a systematic effort to find and report only the strongest results, which will of course make it less likely that subsequent studies in these same areas will replicate well.
Although it is widely recognized that author misconduct, such as HARKing, can bias the results of published studied (and therefore make replication more difficult), it has proved surprisingly difficult to determine how badly HARKing actually influences research results.
There are two reasons for this. First, HARKing might include a wide range of behaviors, from post-hoc analyses that are clearly labelled as such to unrestricted data mining in search for something significant to pubish, and different types of HARKing might have quite different effects. Second, authors usually do not disclose that the results they are submitting for publication are the result of HARKing, and there is rarely a definitive test for HARKing [O’Boyle, Banks & Gonzalez-Mulé (2017) were able to evaluate HARKing on an individual basis by comparing the hypotheses posed in dissertations with those reported in published articles based on the same work, and they suggested that in the majority of the cases they examined, there was considerably more alignment between results and hypotheses in published papers than in dissertations, presumably as a result of post-hoc editing of hypotheses].
In a recent paper Herman Aguinis and I published in Journal of Business and Psychology (see here), we suggested that simulation methods could be useful for assessing the likely impact of HARKing on the cumulative findings of a body of research. In particular, we used simulation methods to try and capture what it is authors actually do when they HARK. Our review of research on HARKing suggested that two particular types of behavior are both widespread and potentially worrisome. First, some authors decide on a research question, then scan results from several samples, statistical tests, or operationalizations of their key variables, selecting the strongest effects for publication. This type of cherry picking does not invent new hypotheses after the data have been collected, but rather samples the data that have been obtained to obtain the best case for a particular hypothesis. Other authors, scan results from different studies, samples, analyses etc. that involve some range of variables, and decide after looking at the data which relationships look strongest, then write up their research as if they had hypothesied this relationship all along. This form of question trolling is potentially more worrisome than cherry picking because these researchers allow the data to tell them what their research question should be rather than using the research question to determine what sort of data should be collected and examined.
We wrote simulations that mimicked these two types of author behaviors to determine how much bias these behaviors might introduce. Because both cherry picking and question trolling represent choosing the strongest results for publication, they are both likely to introduce some biases (and the make the likelihood of subsequent replications lower). Our results suggest that cherry picking introduces relatively small biases, but because the effects reported in the behavioral and social sciences are often quite small (Bosco, Aguinis, Singh, Field & Pierce, 2015), cherry picking can create a substantially boost in the relative size of effect size estimates. Question trolling has the potential to create biases that are sizable in both an absolute and a relative sense.
Our simulations suggest that the effects of HARKing a cumulative literature can be surprisingly complex. They depend on the prevalence of HARKing, the type of HARKing involved and the size and homogeneity of the pool of results the researcher consults before deciding what his or her “hypothesis” actually is.
Professor Kevin Murphy holds the Kemmy Chair of Work and Employment Studies at the University of Limerick. He can be contacted at Kevin.R.Murphy@ul.ie.
REFERENCES
Bedeian, A. G., Taylor, S. G., & Miller, A. N. (2010). Management science on the credibility bubble: Cardinal sins and various misdemeanors. Academy of Management Learning & Education, 9, 715-725.
Ben-Yehuda, N. & Oliver-Lumerman, A. (2017). Fraud and Misconduct in Research: Detection, Investigation and Organizational Response. University of Michigan Press.
Bosco, F. A., Aguinis, H., Singh, K., Field, J. G., & Pierce, C. A. (2015). Correlational effect size benchmarks. Journal of Applied Psychology, 100, 431–449.
Braver, S. L., Thoemmes, F. J., & Rosenthal, R. (2014). Continuously cumulating meta-analysis and replicability. Perspectives on Psychological Science, 9, 333–342. doi:10.1177/1745691614529796
Chang, A. C., & Li, P. (2015). Is Economics Research Replicable? Sixty Published Papers from Thirteen Journals Say ”Usually Not”,” Finance and Economics Discussion Series 2015-083.
Washington: Board of Governors of the Federal Reserve System, doi:10.17016/FEDS.2015.083
Head, M.L., Holman, L., Lanfear, R., Kahn, A.T. & Jennions, M.D. (2015). The Extent and Consequences of P-Hacking in Science. PLOS Biology, https://doi.org/10.1371/journal.pbio.1002106
John, L. K., Loewenstein, G., & Prelec, D. (2012). Measuring the prevalence of questionable research practices with incentives for truth-telling. Psychological Science, 23, 524-532.
Maxwell, S. E. (2004). The persistence of underpowered studies in psychological research: Causes, consequences, and remedies. Psychological Methods, 9, 147–163. doi:10.1037/1082- 989X.9.2.147
O’Boyle, E. H., Banks, G. C., & Gonzalez-Mulé, E. (2017). The chrysalis effect: How ugly initial results metamorphosize into beautiful articles. Journal of Management, 43, NPi. https://doi.org/10.1177/ 0149206314527133.
Open Science Collaboration. (2015). Estimating the reproducibility of psychological science. Science, 349, aac4716. doi:10.1126/science.aac4716
Pashler, H., & Wagenmakers, E. J. (2012). Editors’ introduction to the special section on replicability in psychological science: A crisis of confidence? Perspectives on Psychological Science, 7, 528–530. doi:10.1177/1745691612465253
[From the article “Reproducible research: a minority opinion” by Chris Drummond, published in the Journal of Experimental & Theoretical Artificial Intelligence.]
“Reproducible research, a growing movement within many scientific fields, including machine learning, would require the code, used to generate the experimental results, be published along with any paper. …This viewpoint is becoming ubiquitous but here I offer a differing opinion. I argue that far from being central to science, what is being promulgated is a narrow interpretation of how science works. I contend that the consequences are somewhat overstated. I would also contend that the effort necessary to meet the movement’s aims, and the general attitude it engenders would not serve well any of the research disciplines, including our own.”
“Let me sketch my response here:
– Reproducibility, at least in the form proposed, is not now, nor has it ever been, an essential part of science.
– The idea of a single well-defined scientific method resulting in an incremental, and cumulative, scientific process is, at the very best, moot.
– Requiring the submission of data and code will encourage a level of distrust among researchers and promote the acceptance of papers based on narrow technical criteria.
– Misconduct has always been part of science with surprisingly little consequence. The public’s distrust is likely more to with the apparent variability of scientific conclusions.”
To read more, click here (but note the full article is behind a paywall).
[From the working paper, “Publication Bias and Editorial Statement on Negative Findings” by Cristina Blanco-Perez and Abel Brodeur]
“In February 2015, the editors of eight health economics journals sent out an editorial statement which aims to reduce the incentives to engage in specification searching and reminds referees to accept studies that: “have potential scientific and publication merit regardless of whether such studies’ empirical findings do or do not reject null hypotheses that may be specified.” In this study, we collect z-statistics from two health economics journals and compare the distribution of tests before and after the editorial statement. Our results suggest that the editorial statement decreased the proportion of test statistics rejecting the null hypothesis and that incentives may be aligned to promote more transparent research.”
[From the article “HARKing: How Badly Can Cherry-Picking and Question Trolling Produce Bias in Published Results?” by Kevin Murphy and Herman Aguinis, published in the Journal of Business and Psychology.]
“The practice of hypothesizing after results are known (HARKing) has been identified as a potential threat to the credibility of research results. We conducted simulations using input values based on comprehensive meta-analyses and reviews in applied psychology and management (e.g., strategic management studies) to determine the extent to which two forms of HARKing behaviors might plausibly bias study outcomes and to examine the determinants of the size of this effect. When HARKing involves cherry-picking, which consists of searching through data involving alternative measures or samples to find the results that offer the strongest possible support for a particular hypothesis or research question, HARKing has only a small effect on estimates of the population effect size. When HARKing involves question trolling, which consists of searching through data involving several different constructs, measures of those constructs, interventions, or relationships to find seemingly notable results worth writing about, HARKing produces substantial upward bias particularly when it is prevalent and there are many effects from which to choose. Results identify the precise circumstances under which different forms of HARKing behaviors are more or less likely to have a substantial impact on a study’s substantive conclusions and the field’s cumulative knowledge. We offer suggestions for authors, consumers of research, and reviewers and editors on how to understand, minimize, detect, and deter detrimental forms of HARKing in future research.”
To read more, click here (but note the full article is behind a paywall).
Curate Science (CurateScience.org) is an online platform to track, organize, and interpret replications of published findings in the social sciences, with a current focus on the psychology literature.
We had a very productive year in 2017. Here are some highlights of our accomplishments:
– With N=1,008 replications, we became (to our knowledge) the world’s largest database of curated replications in the social sciences, covering all replications from the Reproducibility Project: Psychology, Many Labs 1 and 3, the Social Psychology special issue, and Registered Replication Reports 1 through 6).
– Several new major features, most important one being a new searchable (and sortable) table of curated replications. One can search by topic, effect, keyword, method used and can sort by sample size and effect size (for both original and replication studies), and many more fields. Curated study characteristics include links to PDFs, open/public data, open/public materials, pre-registered/registered protocols, IVs, DVs, replication type, replication differences, replication active sample evidence, and links to a replication’s associated evidence collection (when available).
– Several important feature improvements (e.g., an improved replication taxonomy and replication outcome categories, each with improved diagrams; improved articulation of our goals and value of curating and tracking replications; see our about section)
– New and expanded curation framework outlined in a manuscript submitted to Advances in Methods and Practices in Psychological Science (which received a “revise & resubmit” on November 13, 2017)
– New partnerships with not-for-profit organizations Meta-Lab and IGDORE (see announcement)
– Submitted/involved in two large grants (outcome to be known in January-February 2018) and we have initiated several new public and not-for-profit grant application opportunities.
– And much more (see here for a list of all of our 2017 announcements; go here to sign up to receive our newsletter)!
Upcoming plans for 2018:
– Continue seeking additional grants to expand our curation capacities (paid curators) and implement our next round of new major features (next point).
– Finalize designs and implement next round of major features currently in development: (1) meta-analyze selected replications, (2) enhanced visualization of complex designs, (3) curating and visualizing multiple outcomes, and (4) public crowdsourcing and replication alerts (see our current developments section for more details).
– Continue development of our two main future directions: (1) analytic reproducibility endorsements and (2) curate and search open/public components for any study (not just replications; see our future directions section for more details).
It’s been a great year for Curate Science, here’s to an even better one in 2018!
Etienne LeBel is an independent meta-scientist affiliated with the University of Western Ontario. Dr. LeBel was awarded a 2015 Leamer-Rosenthal Prize in the Emerging Researcher category for his leadership founding and directing Curate Science, an online platform to curate, track, and interpret replications of published findings in the social sciences and PsychDisclosure.org, a grassroots transparency initiative that contributed to raising reporting standards at leading journals in psychology.
[From a blog on the “Loss of Confidence Project” posted at https://lossofconfidence.com/.]
“The aim of this project is to destigmatize declaring a loss of confidence in one’s own research finding within the field of psychology. We are collecting statements of loss of confidence based on theoretical or methodological problems (see Frequently Asked Questions). Authors can submit a statement via the loss-of-confidence form. Please also read the more detailed inclusion criteria below. We will collect statements until May 2018, and then proceed to compile a list of such statements in the form of a journal article….Our expectation is that all researchers who submit at least one complete loss-of-confidence form fulfilling the inclusion criteria will be co-authors on the resulting paper.”
A standard research scenario is the following: A researcher is interested in knowing whether there is a relationship between two variables, x and y. She estimates the model y = μ0 + μ1 x + ε, ε ~ N(0,σ2). She then tests H0: μ1 = 0 and concludes that a relationship exists if the associated p-value is less than 0.05.
Recently, a large number of prominent researchers have called for journals to lower the threshold level of statistical significance from 0.05 to 0.005 (Benjamin et al., 2017; henceforth B72 – for its 72 authors!). They give two main arguments for doing so. First, an α value of 0.005 corresponds to Bayes Factor values that they judge to be more appropriate. Second, it would reduce the occurrence of false positives, making it more likely that significant estimates in the literature represent real results. Here is the argument in their own words:
“The choice of any particular threshold is arbitrary and involves a trade-off between Type I and II errors. We propose 0.005 for two reasons. First, a two-sided P-value of 0.005 corresponds to Bayes factors between approximately 14 and 26 in favor of H1. This range represents “substantial” to “strong” evidence according to conventional Bayes factor classifications. Second, in many fields the 𝑃 < 0.005 standard would reduce the false positive rate to levels we judge to be reasonable” (B72, page 8).
However, the model that these authors employ ignores two factors which mitigate against the positive consequences of lowering α. First, it ignores the role of publication bias. Second, lowering α would also lower statistical power. So while lowering α would reduce the rate of false positives, it would also reduce the capability to identify real relationships.
In the following numerical analysis, I show that once one accommodates these factors, the benefits of lowering α disappear, so that the world of academic publishing when α = 0.005 looks virtually identical to the world of α = 0.05, at least with respect to the signal value of statistically significant estimates.
B72 demonstrate the benefit of lowering the level of significance as follows: Let α be the level of significance and β the rate of Type II error, so that Power is given by (1-β). Define a third parameter, ϕ, as the prior probability that H0 is true.
In any given study, ϕ is either 1 or 0; i.e., a relationship exists or it doesn’t. But consider a large number of “similar” studies, all exploring possible relationships between different x’s and y’s. Some of these relationships will really exist in the population, and some will not. ϕ is the probability that a randomly chosen study estimates a relationship where none really exists.
B72 use these building blocks to develop two useful constructs. First is Prior Odds, defined as Pr(H1)/Pr(H0) = (1- ϕ)/ϕ. They posit the following range of values as plausible for real-life research scenarios: (i) 1:40, (ii) 1:10, and (iii) 1:5.
Second is the False Positive Rate. Let ϕα be the probability that no relationship exists but Type I error produces a significant finding. Let (1-ϕ)(1-β) be the probability that a relationship exists and the study has sufficient power to identify it. The percent of significant estimates in published studies for which there is no underlying, real relationship is thus given by
(1) False Positive Rate(FPR) = ϕα / [ϕα+(1-ϕ)(1-β)] .
Table 1 reports False Positive Rates for different Prior Odds and Power values when α = 0.05. Taking a Prior Odds value of 1:10 as representative, they show that FPRs are distressing large over a wide range of Power values. For example, given a Power value of 0.50 — the same value that Christensen and Miguel (2017) use in their calculations — there is only a 50% chance that a statistically significant, published estimate represents something real. With smaller Power values — such as those estimated by Ioannidis et al. (2017) — the probability that a significant estimate is a false positive is actually greater than the probability that it represents something real.
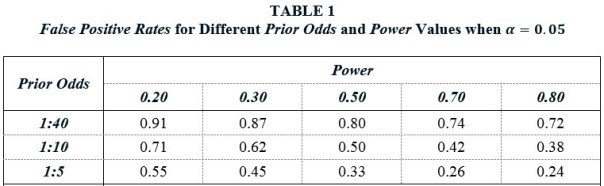
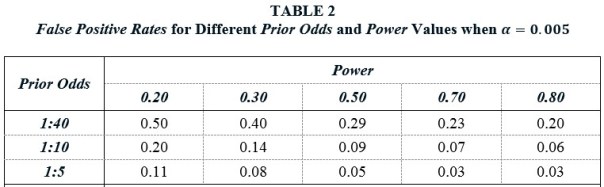
Table 2 shows that lowering α to 0.005 substantially improves this state of affairs. False Positive Rates are everywhere much lower. For example, when Prior Odds is 1:10 and Power is 0.50, the FPR falls to 9%, compared to 50% when α = 0.05. Hence their advocacy for a lower α value.
Missing from the above analysis is any mention of publication bias. Publication bias is the well-known tendency of journals to favor significant findings over insignificant findings. This also has spillovers on the behavior of researchers, who may engage in p-hacking and other suspect practices in order to obtain significant results. Though measuring the prevalence of publication bias is challenging, a recent study estimates that significant findings are 30 times more likely to be published than insignificant findings (Andrews and Kasy, 2017). As a result, insignificant findings will be underrepresented, and significant findings, overrepresented, in the published literature.
Following Ioannidis (2005) and others, I introduce a Bias term, defined as the decreased share of insignificant estimates that appear in the published literature as a result of publication bias. If Pr(insignificant) is the probability that a study reports an insignificant estimate in a world without publication bias, then the associated probability with bias is Pr(insignificant)∙(1-Bias). Correspondingly, the probability of a significant finding increases by Pr(insignificant)∙Bias. It follows that the FPR adjusted for Bias is given by
(2) False Positive Rate(FPR) = [ϕα + ϕ(1-α)Bias] / [ϕα + ϕ(1-α)Bias + (1-ϕ)(1-β) + (1-ϕ)βBias].
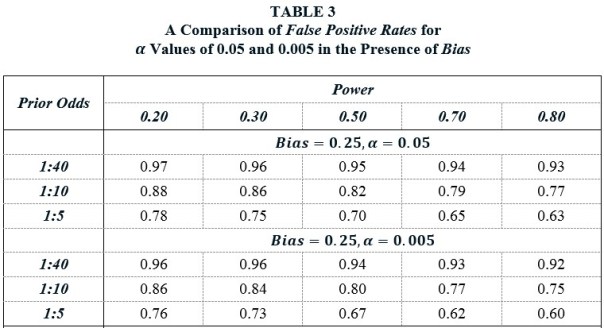
Table 3 shows the profound effect that Bias has on the False Positive Rate. The top panel recalculates the FPRs from Table 1 when Bias = 0.25. As points of comparison, Ioannidis et al. (2017) assume Bias values between 0.10 and 0.80, Christensen and Miguel (2016) assume a Bias value of 0.30, and Maniadis et al. (2017) assume Bias values of 0.30 and 0.40, though these are applied specifically to replications.
Returning to the previous benchmark case of Prior Odds = 1:10 and Power = 0.50, we see that the FPR when α = 0.05 is a whopping 82%. In a world of Bias, lowering α to 0.005 has little effect, as the corresponding FPR is 0.80. Why is that? Lowering α to 0.005 produces a lot more insignificant estimates, which also means a lot more false positives. This counteracts the benefit of the higher significance standard.
Advocates of lowering α might counter that decreasing α would also have the effect of decreasing Bias, since it would make it harder to p-hack one’s way to a significant result if no relationship really exists. However, lowering α would also diminish Power, since it would be harder for true relationships to achieve significance. Just how all these consequences of lowering would play out in practice is unknown, but TABLE 4 present a less than sanguine picture.
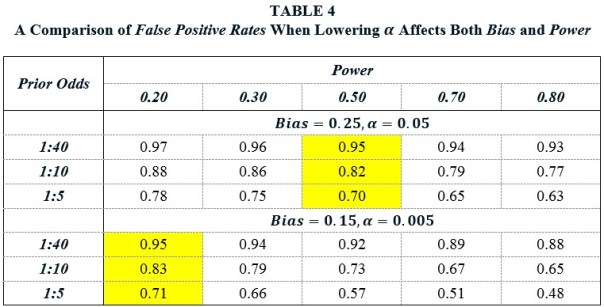
Suppose that before the change in α, Bias = 0.25 and Power = 0.50. Lowering α from 0.05 to 0.005 decreases Bias and Power. Suppose that the new values are Bias = 0.15 and Power = 0.20. A comparison of these two panels shows that the ultimate effect of decreasing α on the False Positive Rate is approximately zero.
It is, of course, possible that lowering α would reduce Bias to near zero values and that the reduction in Power would not be so great as to counteract its benefit. However, it would not be enough for researchers to forswear practices such as p-hacking and HARKing. Journals would also have to discontinue their preference for significant results. If one thinks that it is unlikely that journals would ever do that, then it is hard to avoid the conclusion that it is also unlikely that lowering α to 0.005 would help with science’s credibility problem.
Bob Reed is a professor of economics at the University of Canterbury in New Zealand. He is also co-organizer of the blogsite The Replication Network. He can be contacted at bob.reed@canterbury.ac.nz.
REFERENCES
[From the article “Technology behind bitcoin could aid science, report says” posted online at Physics Today]
“Blockchain, the technology behind the popular digital currency bitcoin, has the potential to transform research and the science publishing landscape. That’s the conclusion of a 28 November report released by the research technology firm Digital Science. By providing a decentralized platform with self-regulating data, blockchain could solve thorny problems concerning such issues as research reproducibility and authorship credit, the report says. However, the technology has drawbacks, and some observers are skeptical of its use in science.”


You must be logged in to post a comment.