[From the article “Five ways to fix statistics” posted at nature.com]
“As debate rumbles on about how and how much to poor statistics is to blame for poor reproducibility, Nature asked influential statisticians to recommend one change to improve science.”
Researchers Jeff Leek, Blakely McShane, Andrew Gelman, David Colquhoun, Michéle Nuijten, and Steven Goodman proffered the following advice:
– “Adjust for human cognition”
– “Abandon statistical significance”
– “State false-positive risk, too”
– “Share analysis plans and results”
– “Change norms from within”
In September of this year, the journal Economics: The Open Access, Open Assessment E-Journal published a series of Discussion Papers for a special issue on “The Practice of Replication”. The motivation behind the special issue came from the following two facts: First, there has been increasing interest in replications in economics. Second, there is still no standard for how to do a replication, nor for determining whether a replication study “confirms” or “disconfirms” an original study.
Contributors to the special issue were each asked to select an influential economics article that had not previously been replicated. They were to discuss how they would go about “replicating” their chosen article, and what criteria they would use to determine if the replication study “confirmed” or “disconfirmed” the original study. They were not to do an actual replication, but rather present a replication plan.
Papers were to consist of four parts: (i) a general discussion of principles about how one should do a replication, (ii) an explanation of why the “candidate” paper was selected for replication, (iii) a replication plan that applies these principles to the “candidate” article, and (iv) a discussion of how to interpret the results of the replication (e.g., how does one know when the replication study successfully “replicates” the original study). The contributions to the special issue were intended to be short papers, approximately Economics Letters-length (though there would not be a length limit placed on the papers).
A total of ten papers were submitted to the special issue and have now been published online as Discussion Papers: nine replication plans and a general thought piece on how to do a replication. They are, respectively:
The papers have been sent out for review and the reviews, along with the authors’ responses, are now beginning to appear online with the papers (the journal is open assessment). Before a decision is made on whether to publish the papers as articles, the journal would like to receive further comments from researchers interested in replications.
Online contributors can comment narrowly on whether a paper successfully carried out its fourfold task (see above). But they can also comment more generally on how they think a replication should be done, and/or how one should interpret the results from a replication.
The ultimate goal is to combine the different papers, the reviewers’ assessments, and the comments from online contributors to develop a set of guidelines for doing and interpreting replications. It is hoped that this “crowd-sourced” approach will bring a large range of perspectives to “the practice of replications.”
To contribute a comment on one or more of the papers, click on the papers’ links above and add a comment, which may require that you first register with the journal. Alternatively, you can email your comment to the special issue’s editor, W. Robert Reed, at bob.reed@canterbury.ac.nz. The deadline to submit comments is January 10, 2017.
Bob Reed is a professor of economics at the University of Canterbury in New Zealand and co-organizer of The Replication Network. He can be contacted at the email listed above.
[From the article “The Dismal Science Remains Dismal, Say Scientists” by Adam Rogers at wired.com]
“WHEN HRISTOS DOUCOULIAGOS was a young economist in the mid-1990s, he got interested in all the ways economics was wrong about itself—bias, underpowered research, statistical shenanigans. Nobody wanted to hear it. “I’d go to seminars and people would say, ‘You’ll never get this published,’” Doucouliagos, now at Deakin University in Australia, says. “They’d say, ‘this is bordering on libel.’””
“Now, though? “The norms have changed,” Doucouliagos says. “People are interested in this, and interested in the science.” He should know—he’s one of the reasons why. In the October issue of the prestigious Economic Journal, a paper he co-authored is the centerpiece among a half-dozen papers on the topic of economics’ own private replication crisis, a variation of the one hitting disciplines from psychology to chemistry to neuroscience.”
[NOTE: This is a repost of a blog that Prasanna Parasurama published at the blogsite Towards Data Science].
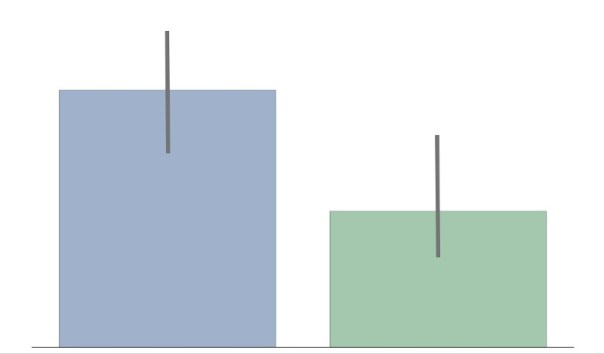
“The confidence intervals of the two groups overlap, hence the difference is not statistically significant”
The statement above is wrong. Overlapping confidence intervals/error bars say nothing about statistical significance. Yet, a lot of people make the mistake of inferring lack of statistical significance. Likely because the inverse — non-overlapping confidence intervals — means statistical significance. I’ve made this mistake. I think part of the reason it is so pervasive is that it is often not explained why you cannot compare overlapping confidence intervals. I’ll take a stab at explaining this in this post in an intuitive way. HINT: It has to do with how we keep track of error.
The Setup
– We have 2 groups: Group Blue and Group Green.
– We are trying to see if there is a difference in age between these two groups.
– We sample the groups to find the mean μ, and standard deviation σ (aka error) and build a distribution: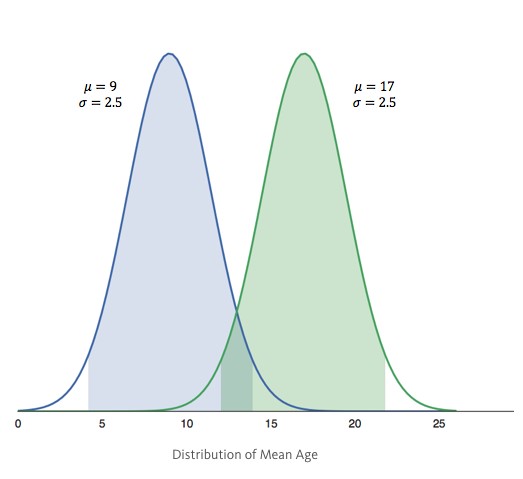 – Group Blue’s average age is 9 years with an error of 2.5 years. Group Green’s average age is 17, also with an error of 2.5 years.
– The shaded regions show the 95% confidence intervals (CI).
From this setup, many will erroneously infer that there is no statistical significant difference between groups, which may or may not be correct.
The Correct Setup
– Instead of building a distribution for each group, we build one distribution for the difference in mean age between groups.
– If the 95% CI of the difference contains 0, then there is no difference in age between groups. If it doesn’t contain 0, then there is a statistically significant difference between groups.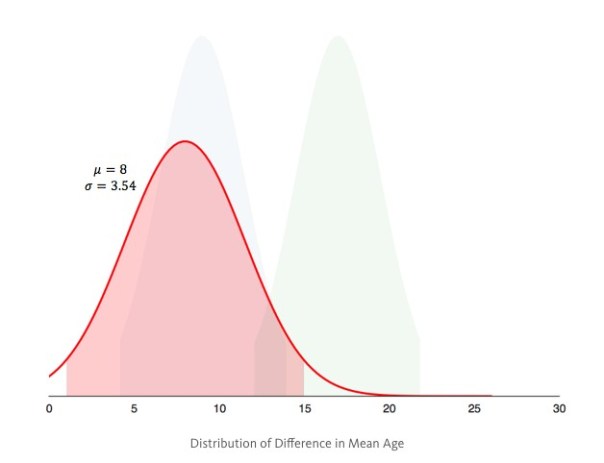 As it turns out the difference is statistically significant, since the 95% CI (shaded region) doesn’t contain 0.
Why?
In the first setup we draw the distributions, then find the difference. In the second setup, we find the difference, then draw the distribution. Both setups seem so similar, that it seems counter-intuitive that we get completely different outcomes. The root cause of the difference lies in error propagation — fancy way of saying how we keep track of error.
Error Propagation
Imagine you are trying to measure the area A of a rectangle with sides L, W. You measure the sides with a ruler and you estimate that there is an error of 0.1 associated with measuring a side.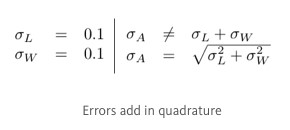 To estimate the error of the area, intuitively you’d think it is 0.1 + 0.1 = 0.2, because errors add up. It is almost correct; errors add, but they add in quadrature (squaring then taking the square root of the sum). That is, imagine these errors as 2 orthogonal vectors in space. The resulting error is the magnitude of sum of these vectors.
Circling Back
The reasons we get different results from the 2 setups is how we propagate the error for difference in age.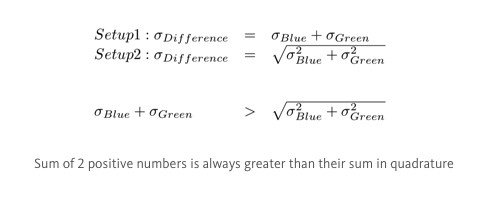 In the first setup, we simply added the errors of each group. In the second setup, we added the errors in quadrature. Since adding in quadrature will yield a smaller value than adding normally, we overestimated the error in the first setup, and incorrectly inferred no statistical significance.
Introduction
The null hypothesis significance testing (NHST) paradigm is the dominant statistical paradigm in the biomedical and social sciences. A key feature of the paradigm is the dichotomization of results into the different categories “statistically significant” and “not statistically significant” depending on whether the p-value is, respectively, below or above the size alpha of the test, where alpha is conventionally set to 0.05. Although prior research has oft criticized this dichotomization for, inter alia, having “no ontological basis” (Rosnow and Rosenthal, 1989) and the arbitrariness of the 0.05 cutoff value, the impact of this dichotomization on the judgments and decision making of academic researchers has received relatively little attention.
Our articles examine this question. We find that the dichotomization intrinsic to the NHST paradigm leads expert researchers from a variety of fields (including medicine, epidemiology, cognitive science, psychology, business, economics, and even statistics) to make errors in reasoning. In particular, when presented with a hypothetical study summary with a p-value experimentally manipulated to be either above or below the 0.05 threshold for statistical significance, we show:
[1] Academic researchers interpret evidence dichotomously primarily based on whether the p-value is below or above 0.05.
[2] They fixate on whether a p-value reaches the threshold for statistical significance even when p-values are irrelevant (e.g., when asked about descriptive statistics).
[3] These findings apply to likelihood judgments about what might happen to future subjects as well as to choices made based on the data.
[4] Researchers’ judgments reflect a tendency to ignore effect size.
We briefly review these findings with a focus, given the audience of this blog, on our results for economists.
Study 1: Descriptive Statements
In our first series of studies, the hypothetical study summary described a clinical trial of two treatments where the outcome of interest was the number of months lived by the patients (average of 8.2 and 7.5 months for treatments A and B respectively). Our subjects were asked a multiple choice question about whether the number of months lived by those who received treatment A was greater, less, or no different than the number of months lived by those who received treatment B or whether it could not be determined.

The correct answer is, of course, that the average number of post-diagnosis months lived by the patients who received treatment A was greater than that lived by the patients who received treatment B (i.e., 8.2 > 7.5) regardless of the p-value. However, as illustrated in Figure 1, subjects were much more likely to answer the question correctly when the p-value in the question was set to 0.01 than to 0.27. Similar results held for researchers in psychology, business, and, to a lesser extent, statistics.
Study 2: Likelihood Judgments and Choices
In our second series of studies, the hypothetical study summary described a clinical trial of two drugs where the outcome of interest was whether or not patients recovered from a disease (e.g., recovery rate of 52% and 44% for Drugs A and B respectively). Our subjects were asked two multiple choice questions: first, a likelihood judgment question about whether a hypothetical patient would be more likely, less likely, or equally likely to recover if given Drug A versus Drug B or whether it could not be determined, and, second, a choice question asking, if they were a patient, whether they would prefer to take Drug A, Drug B, or were indifferent.
The issue at variance in both the likelihood judgment question and choice question is fundamentally a predictive one: they both ask about the relative likelihood of a new patient recovering if given Drug A rather than Drug B. This in turn clearly depends on whether or not Drug A is more effective than Drug B. The p-value is of course one measure of the strength of the evidence regarding the likelihood that it is. However, the level of the p-value does not alter the “correct” response option for either question: the correct answer is option A as Drug A is more likely to be more effective than Drug B (under the non-informative prior encouraged by the question wording this probability is one minus half the two-sided p-value).

As illustrated in Figure 2, the proportion of subjects who chose Drug A for either question dropped sharply once the p-value rose above 0.05 but it was relatively stable thereafter and the magnitude of the treatment difference had no substantial impact on the results. However, the effect of statistical significance was attenuated for the choice question, consistent with the notion that making matters more personally consequential shifts the focus away from concerns about statistical significance and towards whether an option is superior. Similar results held for researchers in cognitive science, psychology, and, to a lesser extent, statistics.

We repeated similar studies on economists. As illustrated in Figure 3, similar results held. However, as illustrated in Figure 3e, the effect is attenuated when the researchers were presented with not only a p-value but also with a posterior probability based on a non- informative prior. This is interesting because, objectively, the posterior probability is a redundant piece of information: as noted above, under a non-informative prior it is one minus half the two-sided p-value.
Conclusion
Researchers from a wide variety of fields, including both statistics and economics, interpret p-values dichotomously depending upon whether or not they fall below the hallowed 0.05 threshold. This is in direct contravention of the third principal of the recent American Statistical Association Statement on Statistical Significance and p- values (Wasserstein and Lazar, 2016)—“Scientific conclusions and business or policy decisions should not be based only on whether a p-value passes a specific threshold”—as well as countless other similar warnings.
What can be done? Our suggestions are not particularly new or original. We should emphasize that evidence, particularly that based on p-values and other purely statistical measures, lies on a continuum. We would go further and say that, in many cases, it does not make sense to calibrate scientific evidence as a function of the p-value, given that this statistic is defined relative to the generally uninteresting and implausible null hypothesis of zero effect and zero systematic error (McShane et al., 2017).
We suggest looking beyond purely statistical considerations and taking a more holistic and integrative view of evidence that includes prior and related evidence, plausibility of mechanism, study design and data quality, real world costs and benefits, novelty of finding, and other factors that vary by research domain. Most importantly, perhaps, we should move away from dichotomous or categorical reasoning whether in the form of NHST or otherwise.
Blakeley B. McShane is an associate professor at the Kellogg School of Management, Northwestern University. David Gal is a professor at the University of Chicago at Illinois College of Business Administration. Correspondence regarding this blog post can be directed to either or both at b-mcshane@kellogg.northwestern.edu and dgaluic@gmail.com respectively.
References
[1] McShane, B.B., and Gal, D. (2016), “Blinding Us to the Obvious? The Effect of Statistical Training on the Evaluation of Evidence.” Management Science, 62(6), 1707-1718.
[2] McShane, B.B. and Gal, D. (2017), “Statistical Significance and the Dichotomization of Evidence.” Journal of the American Statistical Association, 112(519), 885-895.
[3] Rosnow RL, Rosenthal R (1989) Statistical procedures and the justification of knowledge in psychological science. Amer. Psychologist 44:1276–1284.
[4] Wasserstein, R. L., and Lazar, N. A. (2016), “The ASA’s statement on p-values: context, process, and purpose,” The American Statistician, 70(2), 129–133.
[5] McShane, B. B., Gal, D., Gelman, A., Robert, C., & Tackett, J. L. (2017). Abandon statistical significance. arXiv preprint arXiv:1709.07588.
This past week, the International Methods Colloquium hosted a conference call on a recent proposal to reduce the threshold of statistical significance to 0.005. Participants included Daniel Benjamin, Daniel Lakens, Blake McShane, Jennifer Tackett, E.J. Wagenmakers, and Justin Esarey, all of whom have made important contributions to the debate.
Each gave a short presentation of their view, followed by questions from the moderator (Esarey) and then questions from online listeners. Particularly well presented was the relationship between p-values and Bayes factors, and the motivation behind the proposed 0.005 threshold.
The entire podcast, including the Q&A component, is about an hour long. It is an efficient way to get caught up on the debate, and highly recommended.
To read more (and go to the podcast), click here.
[From the article “Results masked review: peer review without publication bias” by Jennifer Franklin at Elsevier.com.]
“We know that research data isn’t neat and tidy. It’s messy, complex and often throws something unexpected at us. At the Journal of Vocational Behavior, as well as some of its fellow journals we’re ok with that, because we want to publish findings that tell the “truth” (or as close as we can get) and we can prove it to you.”
“Results masked review (RMR) is a new form of peer review which allows an article to be judged on the merits of its research question(s) and methodology, not the findings. This ensures that we publish important results, regardless of their statistical significance.” …
“This model has been adapted from Registered Reports, which is a form of empirical article in which the introduction, methods, and proposed analyses are pre-registered and reviewed prior to research being conducted. The key difference with RMR articles is that the data has already been collected before submission to the journal, but only the introduction, and methodology are initially submitted for review.”
“The Journal of Vocational Behavior is one of a number of journals in psychology, business and management considering RMR articles, including the Leadership Quarterly, Journal of Business and Psychology, BMC Psychology and Journal of Personnel Psychology.”
PS We might note that there are no economics journals on the list.
[NOTE: This post refers to the article “The One Percent across Two Centuries: A Replication of Thomas Piketty’s Data on the Concentration of Wealth in the United States” by Richard Sutch. It appears in the current issue of the journal Social Science History].
When Thomas Piketty’s blockbuster on economic inequality, Capital in the Twenty-First Century, appeared several years ago, economists quickly praised and then passed over the data he had packaged in graphic form in order to scrutinize, criticize, and debate his interpretation and analysis. Even those most skeptical of Piketty’s theories offered uncritical praise for his data. Yet, there is a danger lurking here.
The British historian Herbert Butterfield warned that the “truth of history is no simple matter, all packed and parcelled ready for handling in the market-place. … The understanding of the past is not so easy as it is sometimes made to appear” [Butterfield 1931: 132]. Economists, perhaps more so than historians, are apt to take historical statistics as given, ready for interpretation and analysis. They forget that the ingenuity and the artistry that created the spreadsheet of numbers also produces an idiosyncratic picture of the past.
In my article I retrace the steps Piketty took to come up with his estimates for the fraction of the total wealth of the United States owned by the wealthiest one-percent and the wealthiest ten-percent of U.S. households. These time series span two centuries beginning in 1810. Piketty displayed his estimates, conveniently packed and parceled for easy reference, in a single chart (Figure 10.5, p. 348). The book does not go behind the scenes to describe how he came by the numbers; but, to his credit, Piketty made that information available in an online technical appendix.
I conclude that Piketty’s data for the wealth share of the top ten percent over the period 1870-1970 are unacceptable – they add nothing to the evidence base. The values he reported are manufactured from the observations for the top one percent inflated by a constant 36 percentage points. He does not explain or defend this dubious procedure.
Piketty’s data for the top one percent of the distribution for the nineteenth century (1810-1910) are also unhelpful. They are based on a single mid-century observation (for 1870) that provides no guidance about the antebellum trend in inequality and only very tenuous information about trends in inequality during the Gilded Age.
The values for the top one percent that Piketty reported for the twentieth century (1910-2010) are based on more solid ground, but a smoothing procedure he applied to the noisy raw data muted the marked rise of inequality during the Roaring Twenties and the decline associated with the Great Depression. The reversal of the sustained decline in inequality during the 1960s and 1970s and the subsequent sharp rise in the 1980s are hidden by a twenty-six-year interpolation.
Ironically, Piketty underestimated the rise in inequality over the last decade. This neglect of the shorter-run changes is unfortunate because it makes it difficult to discern the impact of policy changes (income and estate tax rates) and shifts in the structure and performance of the economy (depression, inflation, executive compensation) on changes in wealth inequality.
How serious are Piketty’s departures from good practice? On one level, you might say his major point of alarm is undisturbed. His sloppiness caused him to underestimate the seriousness of today’s problem by neglecting the increase in inequality produced by the Reagan-era tax cuts.
But, Piketty goes beyond presenting the numbers in his chart. He makes conjectures about how America became so unequal. He makes predictions about the future. He makes policy suggestions based on those conjectures. His rhetoric implies confidence in his reading of history. His projections and policy solutions imply that the confidence is warranted by a solid under-girding of data.
As an economic historian I am unhappy with his historical narrative. As a citizen I am concerned that policies based uncritically on his theoretical model and predictions will not remedy the problem.
The results I report inflict some damage to Piketty’s credibility. I fear that they also weaken the credibility of the economics profession’s ability to derive insight from a scientific examination of historical data. That is a shame since the increasing concentration of wealth is a serious problem that deserves to be studied by experts and addressed by policy makers.
Richard Sutch is Distinguished Professor of Economics at the University of California, Riverside (emeritus). He can be contacted via email at richard.sutch@ucr.edu.
REFERENCES
Butterfield, Herbert (1931). The Whig Interpretation of History, W.W. Norton, 1965.
Piketty, Thomas (2014). Capital in the Twenty-First Century, translated by Arthur Goldhammer, Harvard University Press, 2014.
Sutch, Richard (2017). “The One Percent across Two Centuries: A Replication of Thomas Piketty’s Data on the Concentration of Wealth in the United States.” Social Science History 41 (4) Winter 2017: 587-613.
[From the article “A statistical fix for the replication crisis in science” by Valen E. Johnson at https://theconversation.com/au.]
“In a trial of a new drug to cure cancer, 44 percent of 50 patients achieved remission after treatment. Without the drug, only 32 percent of previous patients did the same. The new treatment sounds promising, but is it better than the standard?”
“That question is difficult, so statisticians tend to answer a different question. They look at their results and compute something called a p-value. If the p-value is less than 0.05, the results are “statistically significant” – in other words, unlikely to be caused by just random chance.”
“The problem is, many statistically significant results aren’t replicating. A treatment that shows promise in one trial doesn’t show any benefit at all when given to the next group of patients. This problem has become so severe that one psychology journal actually banned p-values altogether.”
“My colleagues and I have studied this problem, and we think we know what’s causing it. The bar for claiming statistical significance is simply too low.”
[From the blog post “Is Piketty’s Data Reliable?” by Alex Tabarrok at Marginal Revolution]
“When Thomas Piketty’s Capital in the Twenty-First Century first appeared many economists demurred on the theory but heaped praise on the empirical work. “Even if none of Piketty’s theories stands up,” Larry Summers argued, his “deeply grounded” and “painstaking empirical research” was “a Nobel Prize-worthy contribution”.”
“Theory is easier to evaluate than empirical work, however, and Phillip Magness and Robert Murphy were among the few authors to actually take a close look at Piketty’s data and they came to a different conclusion: ‘We find evidence of pervasive errors of historical fact, opaque methodological choices, and the cherry-picking of sources to construct favorable patterns from ambiguous data.'”
“Magness and Murphy, however, could be dismissed as economic history outsiders with an ax to grind. …The Magness and Murphy conclusions, however, have now been verified (and then some) by a respected figure in economic history, Richard Sutch.”


You must be logged in to post a comment.