The Replication Network
Furthering the Practice of Replication in Economics
IN THE NEWS: Bloomberg (January 14, 2020)
[Excerpts taken from the article “Behavioral Economics’ Latest Bias: Seeing Bias Wherever It Looks” by Brandon Kochkodin, published at Bloomberg.com]
“Behavioral economics, it seems, might just have a bias problem of its own.”
“…for a small, but vocal group of skeptics, the field has quickly become a victim of its own astounding success. Call it the ‘bias bias.’”
“Drawing on the work of longtime critic Gerd Gigerenzer, an expert in psychology at the Max Planck Institute for Human Development, they point to the tendency of those who have embraced its ideas to see biases everywhere — even when there are none.”
“A Wikipedia entry for cognitive biases currently lists nearly 200 entries…Are they all legit? Gigerenzer, who has made himself into something of a bête noire among behavioral economists over the past couple decades, has his doubts.”
“In his 2018 paper, he concluded that most studies on cognitive biases are flawed. They either rely on small sample sizes, misinterpret individual errors for systematic biases or underestimate how people absorb information based on how a fact or question is framed.”
“Gigerenzer’s beef with behavioral economics, and its most influential proponents, like Kahneman, Amos Tversky and Richard H. Thaler, isn’t new. If you google “behavioral economics criticism,” it doesn’t take long before Gigerenzer’s name comes up, again and again.”
“Kahneman, who was awarded the Nobel Prize in 2002, and Tversky long ago took issue with what they say is Gigerenzer’s willful misinterpretation of their positions and ideas, which misleads readers. Others, like Carnegie Mellon’s Alex Imas, say the problem is that Gigerenzer often uses oversimplified arguments to dismiss theories…”
“Nevertheless, as behavioral economics becomes increasingly ubiquitous in everyday life, even proponents have started to acknowledge the potential pitfalls.”
“In a recent episode of Ted Seides’ “Capital Allocators” podcast, Albert Bridge Capital’s Drew Dickson talked about how his team integrates behavioral economics into its investing approach. After listing some of the biases they watch out for, Dickson named the “bias bias” as his new favorite.
“People are now talking about behavioral finance so much, and a lot of them are relatively new to it, they almost want to start looking as if there’s definitely going to be a bias here,” said Dickson, who declined to comment for this story. “You’re biased to find a bias.”
To read more, click here.
QRP: The Board Game
[Excerpts taken from the “QRP Game Rules”, by Roger Giner-Sorolla, posted at OSF]
“A game of scientific discovery, careers, and reform for 2-6 players or teams.”
Overview
“You, the players, are researchers using sampling statistics to find out more about a yes/no Research Topic.”
“In each of three Rounds, you’ll take turns performing and reporting Experiments, discovering part of the unknown composition of that round’s Evidence Deck.”
“You can also publish your Experiments to gain Prestige points. As you carry out your Experiment, you may commit Fraud, bluffing about your data to improve your chances of being Published. But other players can Investigate you if they don’t believe your findings!”
“There are severe penalties for Fraud, but also penalties for wrongfully Investigating an honest player.”
“Most Experiments also allow for selective reporting of findings (questionable research practices, or QRPs). These can also be Investigated, but with lower stakes.”
“As the game progresses, players introduce Reforms that change the rules of experiments, publishing and Prestige.”
“Reforms move the game towards a science that serves the truth, and away from one that rewards exaggerating positive results.”
“At the end of the Round, new Reforms are introduced, and players advance along the Career Track according to the Prestige they have scored.”
“The game ends after the third Round. Who wins? The player with the most advanced career, or if tied, with the most Prestige in the final Topic.”
To learn more about the game, click here.
Making Meta-Analyses “Open”: A How-To
[Excerpts taken from the article “Conducting a Meta-Analysis in the Age of Open Science: Tools, Tips, and Practical Recommendations” by David Moreau and Beau Gamble, posted at PsyArXiv Preprints]
“In this tutorial, we describe why open science is important in the context of meta-analysis in psychology, and suggest how to adopt the three main components of open science: preregistration, open materials, and open data.”
“We first describe how to make the preregistration as thorough as possible—and how to handle deviations from the plan.”
“We then focus on creating easy-to-read materials (e.g., search syntax, R scripts) to facilitate reproducibility and bolster the impact of a meta-analysis.”
“Finally, we suggest how to organize data (e.g., literature search results, data extracted from studies) that are easy to share, interpret, and update as new studies emerge. “
“For each component, we provide templates that can help standardization while allowing the necessary flexibility to accommodate idiosyncrasies across meta-analyses (see Fig. 1 for an overview).”
“All templates—together with tips on how to best utilize them—are also illustrated with step-by-step video tutorials, in an effort to facilitate systematic implementation in psychology. For each step of the meta-analysis, we provide example templates, accompanied by brief video tutorials…”
Figure 1. Flow chart describing all the provided templates for creating a transparent meta-analysis.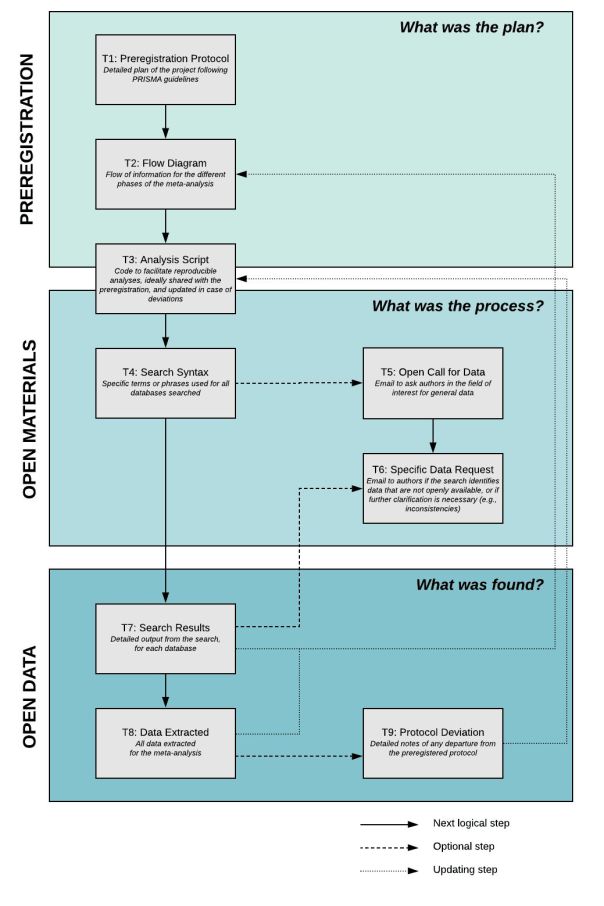
Preregistration
“In the context of meta-analyses…preregistration might seem particularly challenging. How can one know what studies are relevant before running the search, for instance? Will five databases be comprehensive enough, or overkill? What moderator analyses will have enough statistical power? And what methods should be used to detect bias? To facilitate the process of preregistration, we provide a list of items to consider, together with a brief explanation for each, in Template 1…”
“The template is designed to enable flexible yet thorough preregistration, specifically in the context of meta-analyses in psychology. The items follow the PRISMA protocol, but also contain tips and examples specific to our field. We also provide a ready-to-populate flow diagram that adheres to the PRISMA protocol (Template 2).”
“The flow diagram is a visual depiction of the search process in a meta-analysis, from the initial query to the final selection of studies, and including all steps in between. This component is key for transparency, as it provides a quick overview of the data collection process, and serves as a reference document to navigate possible intricacies of the design.”
Open Materials
“A central component of open material relates to sharing scripts for data wrangling and analyses…we provide examples in R, given its appeal for reproducibility and its widespread use in psychology. We designed a generic script (Template 3) that requires minimal tailoring for each individual meta-analysis.”
“To promote reproducibility, it is also crucial to document the exact search syntax used for all databases. We provide a search syntax template that can accommodate different databases, and that has been prepopulated with an example from psychology (Template 4).”
“A thorough meta-analysis often includes articles or reports that were not directly available online…This is an important step, as it helps correct for some of the overall publication bias.”
“In the process of accessing all possible data, a researcher often has to contact authors directly…To facilitate these requests, we provide two email templates that have been worded carefully to ensure the rationale of the request is clear and that authors understand what the project will entail.”
“These templates include an open call for data, to email authors in the field during the initial stage of the search (Template 5), and a specific data request, to email authors of studies that appear to be relevant, but lack information or require clarification (Template 6).”
Open Data
“Template 7 has been designed to allow sharing all content relevant to the search results, thus increasing transparency and facilitating reproducibility. Information such as decisions to include or exclude a study, ambiguities, and the overall breakdown of articles across databases can be documented in this file.”
“In addition, we provide a template to store all data extracted from the search, after it has been curated (Template 8). The template includes metadata about each reference, descriptive statistics, as well as notes and additional information for each study.”
“Finally, regardless of how thoroughly planned a meta-analysis is, researchers will almost inevitably deviate from the original plan.”
“Keeping a record of all deviations from the original protocol is key to facilitate assessment by editors, reviewers, and readers. This record should include the specifics of what has been changed, and the extent of the change.”
“For example, if one changes a preregistered criterion on outlier detection, perhaps because it appears too stringent, it is important to state the difference between the two criteria, as well as the extent to which this impacts the results and the interpretation of the findings.”
“Deviations also need to be justified, that is, a rationale as to why the change was necessary or desired should be provided…Template 9 allows documenting and justifying deviations from planned protocols, and shows some fictional examples from psychology.”
Conclusion
“In this tutorial, we presented a rationale for open science practices in the context of meta-analysis, specifically focused on preregistration, open materials and open data. In an effort to facilitate broad impact and readability, we provided nine standardized templates with tips and recommendations.”
To read the article and access the templates, click here.
Doing More with Confidence Intervals
[Excerpts taken from the article “In Praise of Confidence Intervals” by David Romer, posted at the American Economic Association’s 2020 annual conference website]
“…most modern empirical papers concentrate on two characteristics of their findings: whether the point estimates are statistically significantly different from zero, and the economic interpretation of the point estimates.”
“But in almost all applications, there are potential values of the parameters other than the point estimates and zero that are of interest. Focusing on point estimates and statistical significance obscures the implications of the findings for those values.”
“When a paper only reports that an estimate is significantly different from zero…very little is conveyed about whether the t-statistic is…moderately above 2…or far above 2…smaller t-statistics provide only moderate evidence against values of the parameter that are economically small.”
“Although the key point is that reporting and discussing confidence intervals would often convey much more about the implications of papers’ findings than the usual approach, it is not obvious that the usual 2-standard error confidence interval is the best choice.”
“A common shortcut way of interpreting a confidence interval is that the results provide strong evidence against parameter values outside the interval and are essentially equally supportive of all values inside it.”
“…suppose initially researchers viewed the point estimate and a value at the boundary of the 2-standard error confidence interval as equally likely. Ex post (assuming normality for simplicity), they should view the point estimate as roughly 7 times as likely as the value at the boundary. That is, even though both values are in the confidence interval, the results are considerably more supportive of the point estimate than of the value at the boundary.”
“Even better would be to report both 1-standard error and 2-standard error bands for papers’ key estimates (something that is now sometimes done in figures).”
“Ex post, a researcher who started with flat priors would view the point estimate as only moderately more likely than the other values in the 1-standard error band (…considerably less than twice as likely).”
“…in this case, the natural, and roughly correct, shortcut interpretation would be that the results provide little information about the relative merits of different values within the 1-standard error interval, moderate evidence against values in the 2-standard error but not the 1-standard error interval relative to the point estimate, and strong evidence against values outside the 2-standard error band relative to the point estimate.”
“Consider two possible papers estimating the multiplier for government purchases. In both, the point estimate is 3.0. In one, the standard error is 1.3, while in the other it is 0.7.”
“With the usual current approach to discussing empirical results, the two papers would describe their findings in similar terms. Both would observe that the estimate is statistically significant and would focus on the economic interpretation of a multiplier of 3.”
“In fact, however, the two results would have very different implications for most questions about the multiplier economists are interested in.”
“The one that obtained a standard error of 1.3 (implying a 1-standard error confidence interval of (1.7, 4.3) and a 2-standard error interval of (0.4, 5.6)) would, as before, observe that the hypothesis of a multiplier of zero is rejected. But it would go on to emphasize that the estimate was not very precise: the results provide little evidence against more conventional values of the multiplier such as 1.8, only moderate evidence against a multiplier of 1 or slightly below, and very strong but not overwhelming evidence against a multiplier of zero.”
“The paper with a standard error of 0.7 (and thus a 1-standard error confidence interval of (2.3, 3.7) and a 2-standard error interval of (1.6, 4.4)), in contrast, would observe that a multiplier of zero was not merely rejected, but rejected overwhelmingly, And it would proceed to point out that the results provide quite strong evidence against not just zero but against values of 1 and below, and that they even provide moderately strong evidence against recent estimates in the vicinity of 1.8.”
“All this could be accomplished with the addition of a sentence or two reporting confidence intervals, a few adjectives (“imprecise,” “overwhelming,” “moderate,” and so on), and a few sentences describing the confidence intervals’ implications for key candidate values of the multiplier.”
“…reporting the confidence intervals for papers’ focal estimates and briefly discussing their key implications would add only trivially to papers’ length, and would often greatly increase the amount of information conveyed about the economic implications of the findings.”
To read the article, click here.
Open Science Practices in the Social Sciences: A Progress Report
[Excerpts taken from the article “Open Science Practices are on the Rise: The State of Social Science (3S) Survey” by Christensen et al., posted at MetaArXiv Preprints]
“…how many social scientists are adopting open science practices, and what are the average perceptions of these practices in the social sciences?”
“The present research, based on the State of Social Science (3S) Survey, generates a…robust estimate of the adoption of open science practices over time, and of general support and perceived norms of research transparency across four major social science disciplines: economics, political science, psychology and sociology.”
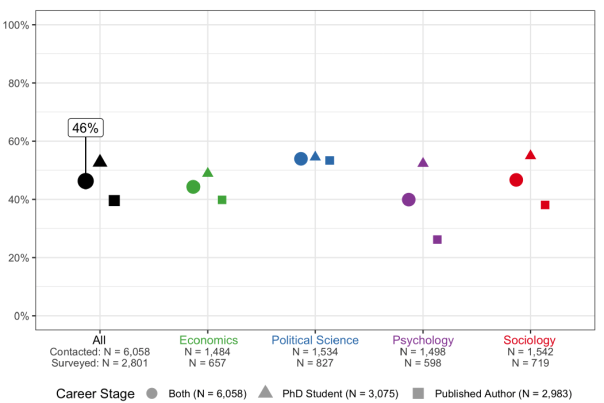
“We solicited information using a monetarily incentivized survey from a representative sample of active, elite social science researchers…”
“We randomly drew the sample from the complete set of authors who had published within a range of 3 years (2014-2016) in 10 of the most cited journals for each discipline. We also drew from the complete set of PhD Students enrolled in the top 20 North American departments in each discipline during the first half of 2018…”
“Our incentive scheme achieved a completed survey response rate of 46.2%, implying that the study sample is broadly representative of active Published Authors and PhD Students in these four fields. Figure 1 presents the overall response rate of 46.2%, which ranged from 40% in Psychology to 55% in Political Science”.
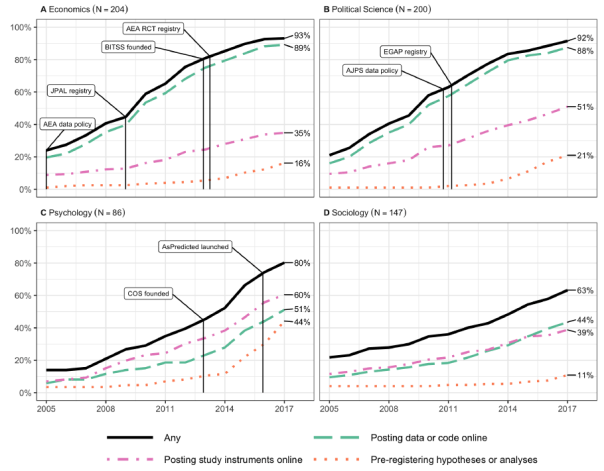
“Figure 2 presents the cumulative proportion of Published Authors who have adopted open science practices over time.”

“The sharing of data, code and survey instruments show rapid increases starting after 2005, while the use of pre-registration has increased dramatically since 2013. Posting data or code online is the most common practice, followed by posting study instruments online, and then pre-registration…”
“Figure 3 shows that adoption patterns differ across disciplines.”
“How do social scientists perceive their fields today, in terms of support for and adoption of open science practices?”
“Figure 6 depicts scholars’ perceptions of their field…against the actual distribution of opinion and adoption rates as reported by survey respondents in their field.”

“Within each panel, the first bar shows the perceived distribution of support for the practice among Published Authors. This is constructed by asking individuals what percentage of researchers in their field they believe fall into each opinion category…The solid black bar below shows the fraction of researchers in their field they believe have done the practice.”
“The third bar in the panel shows the distribution of support for the practice constructed using the responses elicited from the Published Authors that we sampled. The final solid black bar shows the proportion of researchers who have actually done the stated practices, using the responses elicited from our survey.”
“Two findings are apparent. First, perception of support, in green, is consistently smaller than actual support…Second, perception of opposition toward open science practices is much greater than actual (survey-estimated) opposition…”
Discussion
“Data from a recent representative survey of scholars in four large social science disciplines – economics, political science, psychology, and sociology – indicates that the adoption of open science practices has been increasing rapidly over the past decade.”
“Behaviors such as posting data and materials that were nearly unknown in some fields as recently as 2005 are now practiced by the majority of scholars. Other newer practices, such as study pre-registration, have experienced a sharp rise in adoption just in recent years, especially among scholars who engage in experimental research.”
“The second main finding of the analysis is that stated support for open science practices is outpacing both their actual adoption and respondents’ beliefs about others’ support…this pattern suggests that social science research communities are in a period of rapid transformation in terms of their research practices, a shift that is not yet entirely appreciated by the community.”
To read the article, click here.
Free Webinar on Pre-Registation by the Center for Open Science
[From an email sent by Claire Riss, Communications and Outreach Coordinator for the Center for Open Science]
“The Center for Open Science is conducting a webinar entitled The What, Why, and How of Preregistration on January 21 at 10 am Eastern Time (US and Canada).”
“…preregistration can substantially mitigate uncertainty and fundamental human error in research, such as hindsight bias. But there are still many questions as to its appropriateness across studies and impact on discovery.”
“The COS staff looks forward to diving deeper during the webinar into the practical preregistration workflow on the OSF and the long-term implications for improving science through preregistration. In addition, all attendees will have the opportunity to get their specific questions answered during a Q&A.”
“…we hope to see you there at this important conversation. Take a moment to register for the webinar here.”
“Will you share the webinar registration page with anyone in your community that may benefit from this conversation? Thank you on behalf of the COS team.”
FIALA: Is the Evidence for the Lack of Impact of Microfinance Just a Design Problem?
Microfinance is one of the most hotly debated interventions in developing countries over the last 20 years. These are generally small loans, often given to women with short repayment periods and high interest rates (though often much lower than local market rates).
Proponents argue that the poor often are severely cash constrained and a little bit of money can help them to realize their economic potential. Researchers and policy makers have been worried about people being caught in debt traps, making their poverty worse. Prior to the rise of randomized control trials (RCTs) in economics the evidence either way was mostly anecdotal.
Then some experimental evidence started to emerge, and the results were not encouraging. Karlan and Zinman (2011) and then six other RCT studies published in a 2015 special issue of the American Economic Journal: Applied Economics found no statistically significant economic impacts from giving people small loans. In Fiala (2018) I found some positive short-run impacts, but only for men.
However, not all evidence, even experimental, is created equal. In Dahal and Fiala (2020) we closely re-analyze these eight papers to examine just how well these studies were designed to answer the questions they wanted to answer. We find that the lack of statistical significance is likely not due to a lack of impacts. Rather, the problem is that these studies are extremely underpowered. I
ndividual coefficients are actually quite large, but the standard errors are even bigger. Ex-post power calculations for each of the studies show the minimum detectable effect (MDE) size for main outcomes is up to 1,000%. Median (mean) MDE is 132% (201%). The authors find effects closer to 30%, a large impact but far from what is needed to be statistically significant.
Why are these studies so underpowered? One of the biggest reasons is that there is significant non-compliance. Take-up rates of loans in the treatment groups is generally low. Often the difference between take-up of loans between treatment and control groups is tiny. Three of the American Economic Journal: Applied Economics papers have net compliance rates less than 10 percentage points, making reasonable inference almost impossible.
While some of the authors of the original studies acknowledge potential issues of low power, they never quantify them. This lack of transparency has led many people, including the original authors, to describe the null results as precisely estimated.
Our analysis opens up a bigger problem within experimental methods in general: RCTs can be the gold standard of inference, but only when designed and implemented properly on questions they can be used to answer.
The problems of design in microfinance isn’t due to low quality researchers running poor quality studies. Two of the recent Noble Prize winners in Economics are authors of these studies, and one of them was the editor of the American Economic Journal: Applied Economics when these studies were published. One of the papers had been a working paper for years. Even looking back at the standards of 2015, none of these studies passed what was considered appropriate quality.
Although these papers do not show a “transformative” impact of microfinance on the lives of poor households, careful reading of the papers reveals that they also do not discredit the role of microcredit in poverty alleviation and improving livelihoods of poor households.
The main conclusion of Dahal and Fiala (2020) is that we actually have no idea about the impact of microfinance on the lives of poor people because there is not a single study looking at the impact of the traditional microfinance model that is designed well enough to answer this question.
Nathan Fiala is an assistant professor at the University of Connecticut, honorary senior lecturer at Makerere University in Uganda, and a research fellow at RWI in Essen, Germany. He can be contacted at nathan.fiala@uconn.edu.


You must be logged in to post a comment.