[From the blog “Estimating the Replicability of Psychological Science” by Ulrich Schimmack, posted at Replicability-Index]
“Over the past years, I have been working on an … approach to estimate the replicability of psychological science. This approach starts with the simple fact that replicabiliity is tightly connected to the statistical power of a study because statistical power determines the long-run probability of producing significant results (Cohen, 1988). Thus, estimating statistical power provides valuable information about replicability.”
“In collaboration with Jerry Brunner, I have developed a new method that can estimate mean power for a set of studies that are selected for significance and that vary in effect sizes and samples sizes, which produces heterogeneity in power (Brunner & Schimmack, 2018).”
“The input for this method are the actual test statistics of significance tests (e.g., t-tests, F-tests). These test-statistics are first converted into two-tailed p-values and then converted into absolute z-scores. …The histogram of these z-scores, called a z-curve, is then used to fit a finite mixture model to the data that estimates mean power, while taking selection for significance into account.”
“For this blog post, I am reporting results based on preliminary results from a large project that extracts focal hypothesis from a broad range of journals that cover all areas of psychology for the years 2010 to 2017.”
“The figure below shows the output of the latest version of z-curve. The first finding is that the replicability estimate for all 1,671 focal tests is 56% with a relatively tight confidence interval ranging from 45% to 56%.”

“The next finding is that the discovery rate or success rate is 92%, using p < .05 as the criterion. This confirms that psychology journals continue to published results are selected for significance (Sterling, 1959).”
“Z-Curve.19.1 also provides an estimate of the size of the file drawer. … The file drawer ratio shows that for every published result, we would expect roughly two unpublished studies with non-significant results.”
“Z-Curve.19.1 also provides an estimate of the false positive rate (FDR). … Z-Curve 19.1 … provides an estimate of the FDR that treats studies with very low power as false positives. This broader definition of false positives raises the FDR estimate slightly, but 15% is still a low percentage. Thus, the modest replicability of results in psychological science is mostly due to low statistical power to detect true effects rather than a high number of false positive discoveries.”
“This blog post provided the most comprehensive assessment of the replicability of psychological science so far. … replicability is estimated to be slightly above 50%. However, replicability varies across discipline and the replicability of social psychology is below 50%. The fear that most published results are false positives is not supported by the data.”
[From the article “The Importance of Predefined Rules and Prespecified Statistical Analyses: Do Not Abandon Significance” by John Ioannidis, published in JAMA]
“A recent proposal to ban statistical significance gained campaign-level momentum in a commentary with 854 recruited signatories. The petition proposes retaining P values but abandoning dichotomous statements (significant/nonsignificant), suggests discussing “compatible” effect sizes, denounces “proofs of the null,” and points out that “crucial effects” are dismissed on discovery or refuted on replication because of nonsignificance.”
“Changing the approach to defining statistical and clinical significance has some merits; for example, embracing uncertainty, avoiding hyped claims with weak statistical support, and recognizing that “statistical significance” is often poorly understood. However…The statistical data analysis is often the only piece of evidence processing that has a chance of being objectively assessed before experts, professional societies, and governmental agencies begin to review the data and make recommendations.”
“The proposal to entirely remove the barrier does not mean that scientists will not often still wish to interpret their results as showing important signals and fit preconceived notions and biases. With the gatekeeper of statistical significance, eager investigators whose analyses yield, for example, P = .09 have to either manipulate their statistics to get to P < .05 or add spin to their interpretation to suggest that results point to an important signal through an observed “trend.” When that gatekeeper is removed, any result may be directly claimed to reflect an important signal or fit to a preexisting narrative.”
“…there is an advantage in having some agreement about default statistical analysis and interpretation. Deviations from the default would then be easier to spot and questioned as to their appropriateness. For most research questions, post hoc analytical manipulation is unlikely to lead closer to the truth than a default analysis with a basic set of rules.”
“Banning statistical significance while retaining P values (or confidence intervals) will not improve numeracy and may foster statistical confusion and create problematic issues with study interpretation, a state of statistical anarchy. Uniformity in statistical rules and processes makes it easier to compare like with like and avoid having some associations and effects be more privileged than others in unwarranted ways. Without clear rules for the analyses, science and policy may rely less on data and evidence and more on subjective opinions and interpretations.”
[From the article “Implementing publisher policies that inform, support and encourage authors to share data: two case studies” by Leila Jones, Rebecca Grant, and Iain Hrynaszkiewicz, published in Insights: the UKSG journal]
“As scholarly journals and publishers find themselves at the heart of the shift towards openness, it is not surprising that 2017–2018 saw an increase in data-sharing policies from major publishers, resulting in a significant number of scholarly journals with policies aiming to increase transparency.”
“In this article we present two case studies which examine the experiences that two different publishers have had in rolling out data-sharing policies.”
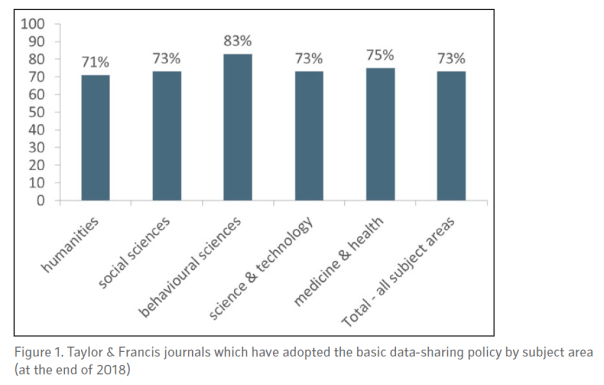
“Taylor and Francis data-sharing policies are tiered, with the five standard policies offering increasing levels of expectations around how and when data should be shared. The basic … encourages authors to share and cite data.”
– “basic: journal authors are encouraged to share and make data open where this does not violate protection of human subjects or other valid subject privacy concerns. Authors are further encouraged to cite data and provide a data availability statement.”
– “share upon reasonable request: authors agree to make their data available upon reasonable request. It’s up to the author to determine whether a request is reasonable. Data availability statements are mandatory.”
– publicly available: authors make their data freely available to the public under a licence of their choice. Data availability statements are mandatory.
– “open data: authors must make their data freely available to the public, under a licence allowing re-use by any third party for any lawful purpose. Data availability statements and data citation are mandatory. Data shall be findable and fully accessible.”
– “open and fully FAIR: authors must make their data freely available to the public under a licence allowing reuse by any third party for any lawful purpose. Data availability statements and data citation are mandatory. Additionally, data must meet with FAIR standards as established in the relevant subject area.”
“As of the end of 2018, over 1,600 journals published by Taylor & Francis (which includes over 300 journals published in conjunction with a learned society) have the basic data-sharing policy in place. (See Figure 1, showing the percentage of these journals by subject area.) Additional journals are agreeing on a regular basis.”
“It is fair to say that the response to the launch of our policies has been polarized, with some partners describing the change as ‘important and valuable’ while other editors or society officers expressed feeling ‘alarmed’ and ‘not enthusiastic’ about the prospect of open data for their subject area or journal(s).”
“Our decision to focus on driving adoption of our basic policy (where the key word is ‘encourage’) in the first year naturally has pros and cons. We still have a lot of work to do to move journals on to more progressive policies, but we look forward to working with our partners on that priority in 2019 and beyond.”
“Challenges aside, we have succeeded in rolling out a data-sharing policy for a significant number of journals in a short time. In doing so, we are exposing a large number of authors to the notion of a data-sharing policy. We are facilitating conversations about the benefits of open practices and encouraging changes to existing behaviours around data. We think that is a valuable starting point.”
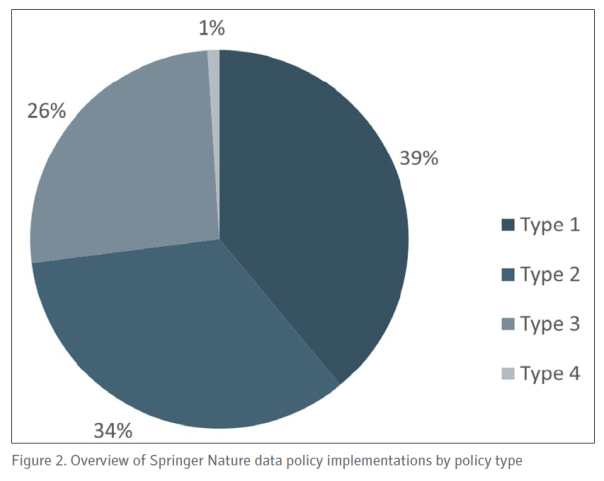
“Springer Nature began rolling out standard research data policies in 2016….Four standard policy types are available, with increasingly stringent requirements for data sharing by authors as they progress from Type 1 through to the Type 4 policy.”
– “Type 1 journals: authors are encouraged to share their data, preferably in repositories, and to cite publicly available data sets in their reference lists.”
– “Type 2 journals: authors are strongly encouraged to share their data, preferably in repositories, and to cite publicly available data in their reference lists. Authors are also encouraged to include a statement of data availability with their manuscript.”
– “Type 3 journals: authors are strongly encouraged to share their data, preferably in repositories, and to cite publicly available data in their reference lists. Authors are required to include a statement of data availability with their manuscript.”
– “Type 4 journals: authors are required to share their data in a repository, to include a statement of data availability with their manuscript, and to make their data available for peer review.”
“As of November 2018, more than 1,500 journals Springer Nature have a standard policy, with additional journals being implemented on a weekly basis. At time of writing in early 2019, 39% of the journals with a policy have Type 1, 34% have Type 2, 26% Type 3, and less than one per cent (six journals) have Type 4 (Figure 2). …In due course, it is anticipated that more journals will adopt the higher-level policies, and the publisher has an important role in supporting and enabling this transition.”
“A key aspect of the Type 2, 3 and 4 data policies at Springer Nature is the recommendation (or requirement) that an author includes a statement of data availability with their manuscript. …The use of these statements provides a standardized way for authors to describe how their data are shared. Data availability statements do not necessarily mean data are readily available, as authors may still choose to share data on request, or state that their study did not generate or analyse data.”
“The implementation of data policies can be a driver for these statements becoming a standard feature across published research,…. Data availability statements were first introduced in 2016 by Nature Research journals, bringing their policies in line with Springer Nature’s Type 3 data policy, and have since been made into a distinct section of each article, similar to the methods section. This gives information on data availability similar prominence to Methods and Results…”
“The two case studies described in this paper demonstrate the common concerns of publishers in providing standard research data policies to their authors. … While encouraging good practice, policies must also be developed to reflect the culture of the discipline they apply to, and publishers must ensure that researchers understand what their obligations are. …Compliance is also key, and where policies mandate certain behaviours (such as the inclusion of data availability statements in published papers), editorial staff must be trained and resourced to make the required checks.”
To read the article, click here.
[From the article “Embrace the unknown” by Chris Ferguson, published in The Psychologist]
“Consider the basic premise ‘Does X cause Y?’ It’s at the root of almost any question of interest to the general public or policy makers. Does cognitive-behavioural therapy treat PTSD? Does the TV show 13 Reasons Why cause suicide in teens? Can implicit racism be tested for, and does training reduce racism in society? …it is often in the interest of professional guilds – the advocacy organisations that represent psychology and other sciences – to give simple answers.”
“Science laundering is the washing away of inconvenient data, methodological weaknesses, failed replications, weak effect sizes, and between-study inconsistencies. The cleaned-up results of a research field are then presented as more solid, consistent and generalisable to real-world concerns than they are.”
“As one recent example, Jean Twenge and colleagues (2018) released a study, covered widely in the press, linking screen use to youth suicides. However, another scholar with access to the same dataset noted in an interview that the magnitude of effect is about the same as for eating potatoes on suicide (see Gonzalez, 2018: effect sizes ranged from r = .01 to .11 depending on outcome).”
“Some readers may be thinking, ‘Isn’t it better to attempt to apply psychology to important societal issues even if the evidence available falls short of being conclusive? How certain do we really need to be before we stop fretting about overselling the value of our science?’”
“I take an unapologetically hard line on this: honesty must be a fundamental facet of scientific communication. We cannot and should not sweep under the rug inconvenient data, methodological weaknesses or tiny effect sizes for the sake of an appealing narrative, no matter how heartfelt that narrative may be.”
[From the blog “Why researchers should publish their data” by Karl Rubio, posted at http://www.povertyactionlab.org]
“There has been a growing research transparency movement within the social sciences to encourage broader data publication. In this blog post we share some background on this movement and recent statistics, key factors for researchers to consider before publishing data, and tools and resources to support data publication efforts.”
“There are many long-run benefits to publishing original research data. Open data can increase visibility of the research and number of citations counts. For example, there is some evidence that publishing research articles for open access, rather than behind a paywall, increases citations.”
“Similarly, a preliminary paper by J-PAL affiliate Ted Miguel, with Garret Christensen and Allan Dafoe, concluded that papers in top economics and political science journals with public data and code are cited between 30-45 percent more often than papers without public data and code.”
“Open data has the potential to generate new ideas and spark new collaborations between researchers and policymakers–but it only serves this purpose when others are actually reusing the data. For example open data becomes a public good when data are reused for:”
– “Research (reanalysis, meta-analysis, secondary analysis, replication)”
– “Teaching (curriculum use for presentations and assignments)”
– “Learning (dataset exploration)”
“The J-PAL Dataverse, a subset dataverse in the Harvard Dataverse, is an open data repository which stores data associated with studies conducted by J-PAL affiliated researchers.”
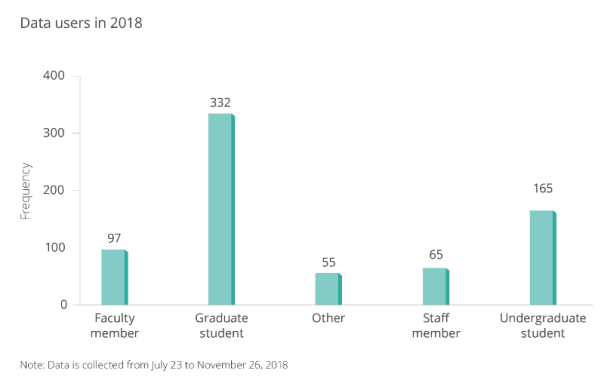
“We collected data from our database in J-PAL Dataverse users using a guestbook to better understand who was accessing this open data, and for what purpose.”

“J-PAL and our partner organization Innovations for Poverty Action (IPA) have created resources to help researchers publish their data and improve research transparency. IPA’s best practices for data and code management illustrate good coding practices that can be used to help clean and finalize your data and code before publication. J-PAL North America’s data security procedures for researchers provide context on elements of data security and working with individual-level administrative and survey data.”
[From the working paper “On the economic importance of the determinants of long-term growth” by Olivier Sterck, posted at the Centre for the Study of African Economies working papers website]
“The long-run growth literature abounds with statements about the“economic significance” or “economic importance” of variables of interest. To justify these statements, authors usually report the standardized beta coefficient associated with the variable of interest, or, more rarely, the partial R2 or the Shapley value.”
“I show that these statistics are inadequate to measure economic importance.”
“I …propose two complementary methods to measure the economic importance of variables and residuals in regressions. … Both methods aim at measuring the percentage contribution of each explanatory variable to variation in the dependent variable. They differ in how they handle variation induced by explanatory variables that are correlated.”
“According to the ceteris paribus approach, the importance of a variable xi is measured as:”

“The measure qi2 captures the variation generated by the explanatory variable xi ceteris paribus and expresses it in percentage terms.”
“The second method focuses on non-ceteris paribus variation: the importance of an explanatory variable not only depends on the variation it generates alone, but also on the variation co-generated with other explanatory variables. …. According to the non-ceteris paribus approach, … the importance of a variable xi is measured as:”

“…I show that it can be interpreted as the elasticity of Var(y) with respect to Var(βixi). The measure is therefore positive if a marginal increase in βi increases Var(y), and negative if a marginal increase in βi reduces Var(y).”
“The two measures are complementary. They bring different information, especially when they sharply differ. For example, if the ceteris paribus importance of a variable is much larger than its non-ceteris paribus importance, it means that the effect of that variable is going against the effects of other variables included in the estimated model. On the contrary, if the ceteris paribus importance of the variable is much smaller than its non-ceteris paribus importance, it means that the effect of that variable is reinforcing the effect of other important variables.”
“As research analyzing large datasets is more and more frequent, evaluating economic importance is becoming as – if not more – important than assessing statistical significance. This research proposed two intuitive methods to measure importance that usefully complement standard measures of statistical significance.”
To read the article, click here.
[From the paper “Statistical Methods for Replicability Assessment” by Kenneth Hung and William Fithian, posted at ArXiv.org. Note that H&K’s paper is primarily concerned with presenting an empirical procedure for addressing questions about replicability after correcting for selection bias. This post highlights their observation about the importance of selection bias in interpreting replication results.]
“While concerns about replicability cut across scientific disciplines, psychologists have led large-scale efforts to assess the replicability of their own field. The largest and most systematic of these efforts has been the Reproducibility Project: Psychology (RP:P), a major collaboration by several hundred psychologists to replicate a representative sample of 100 studies published in 2008 in three top psychology journals.”
“Open Science Collaboration (OSC; 2015) reported three main metrics: it found that 64% (= 1 − 36%) of the replication studies did not find statistically significant results in the same direction as the original studies, that 53% (= 1 − 47%) of 95% confidence intervals for the replication studies do not contain the point estimates for their corresponding original studies, and that 83% of the effect size estimates declined from original studies to replications. All three summary statistics were widely reported as indicating a dire crisis for the credibility of experimental psychology research.”
“…none of the three reported metrics can be taken at face value as estimates of the answers to the corresponding questions, due to the confounding factor of pervasive selection bias.”
“The RP:P data shows unmistakable signs of selection for statistically significant findings in the original experiments: 91 of the 100 results replicated by OSC were statistically significant at the 0.05 level in the original study and four of the others had “marginally significant” p-values between 0.05 and 0.06.”
“This is due partly to publication bias (that the studies might not have been published, or the results discussed, if the p-values had not been significant), but also partly to OSC’s method for choosing which results to replicate. Each OSC replication team selected a “key result” from the last experiment presented in the original paper, and evidently most teams chose a significant finding as the key result (justifiably so, since positive results usually draw the most attention from journal readers and the outside world).”
“The resulting selection bias in the original studies leads to many well-known and predictable pathologies, such as systematically inflated effect size estimates, undercoverage of (unadjusted) confidence intervals, and misleading answers from unadjusted meta-analyses. Indeed, most of the phenomena reported by OSC, including the three metrics discussed above, could easily be produced by selection bias alone.”
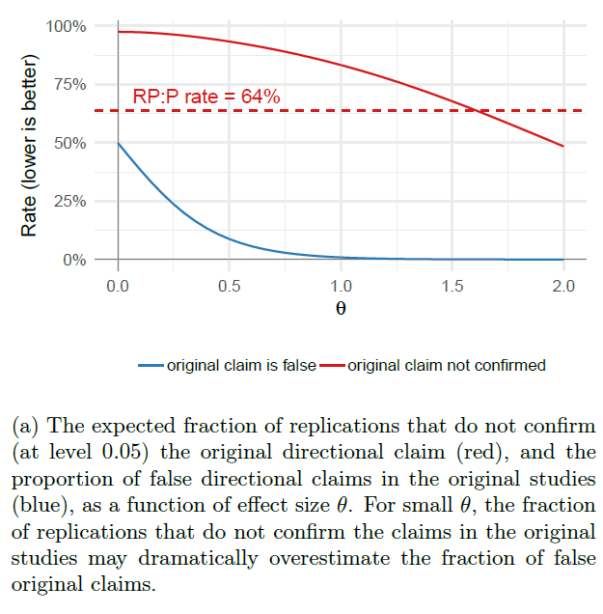
“Consider a stylized setting where all experiments (both original and replication) have an identical effect size θ, producing an unbiased Gaussian estimate with standard error 1. Assume, however, that we observe only study pairs for which the original study is significant at level 0.05.”
“Figure 2a shows the expected fraction of replication studies which are not statistically significant in the same direction as the corresponding original studies, as a function of effect size θ, along with the true proportion of false directional claims; or type S errors. Even when the true error rate is low, e.g. at θ = 1 as shown in Figure 2b, the proportion of replications reporting the same directional findings as the original studies can remain low.”
FIGURE 2

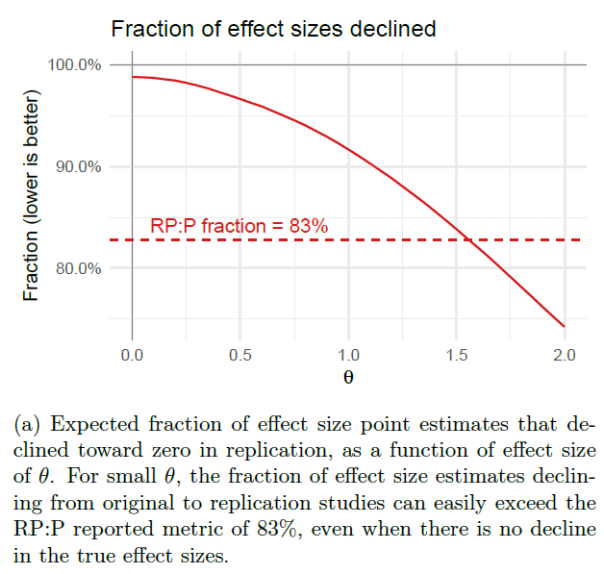
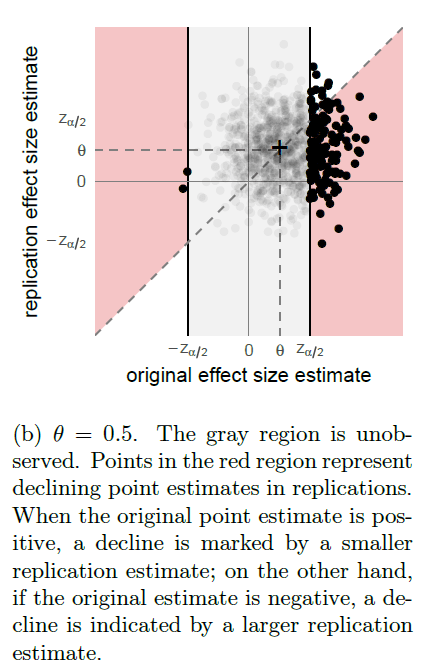
“Likewise, we simulate the expected fraction of 95% replication confidence intervals that fail to cover their original point estimates in Figure 3 and the expected fraction of effect sizes that decline in Figure 4. In both cases, we see that selection bias is more than sufficient to produce the metrics in RP:P, even in our idealized simulation with exact replications and relatively few type S errors.”
FIGURE 3
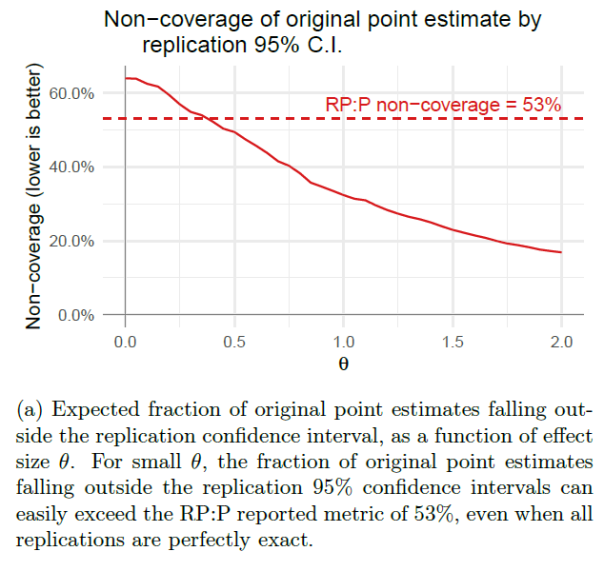

FIGURE 4
“Because selection bias could, in principle, provide a sufficient explanation for the metrics reported in RP:P, those metrics do not, in and of themselves, provide any evidence of any other problems. In particular, they shed no light on whether the FDR is actually high, or how much the effect sizes shifted, or whether effect sizes tend to decline. Nor do they provide evidence for any competing accounts of the replication crisis, such as QRPs like p-hacking, high between-study variability in effect sizes, or systematic biases in the original studies.”
To read the article, click here.
[From the article “Stats Experts Plead: Just Say No to P-Hacking” by Dalmeet Singh Chawla, published in Undark]
“For decades, researchers have used a statistical measure called the p-value — a widely-debated statistic that even scientists find difficult to define — that is often a requirement for publication in academic journals. In many fields, experimental results that yield a p-value less than 0.05 (p<0.05) are typically labelled as “statistically significant.” Lower p-values imply that a result is more likely real, instead of a statistical fluke.”
“Playing with data to meet the significance thresholds required for publication — known as p-hacking — is an actual thing in academia.”
“In response to concerns, the ASA has released advice on how researchers should — and should not — use p-values, devoting an entire issue of its quarterly publication, The American Statistician, to the topic.”
“The ASA is suggesting a different approach. The organization wants to move academic research beyond significance thresholds, so that studies aren’t selectively published because of their statistical outcomes.”
“Not everyone is convinced the ASA’s recommendations will have the desired effect.”
“‘Statisticians have been calling for better statistical practices and education for many decades and these calls have not resulted in substantial change,’ Trafimow says. ‘I see no reason to believe that the special issue or editorial would have an effect now where similar calls in the past have failed.'”
“Others question the ASA’s approach. “I don’t think statisticians should be telling researchers what they should do,” says Daniël Lakens, an experimental psychologist at Eindhoven University of Technology in the Netherlands. Instead, he adds, they should be helping researchers ask what they really want to know and give more tailored field-specific practical advice.”
“Unlike the ASA in its editorial, Johnson believes that researchers, especially non-statisticians, would benefit from thresholds to indicate significance.”
“Lakens, who advocates for researchers to choose thresholds as long as they justify them, agrees, noting that bright line rules may be necessary in some fields.”
“But allowing cut-offs, even in select cases, may mean that researchers’ biases encourage p-hacking — even if unconsciously, notes Regina Nuzzo, a statistician at Gallaudet University in Washington D.C. and an associate editor of the ASA’s special issue. For Nuzzo, a substantial change will require educating researchers during college years …”
[From the article “Nature editor: researchers should be forced to make data public” by David Matthews, published at Times Higher Education]
“The editor-in-chief of Nature has said that she would like to force researchers to make the data and code behind their discoveries openly available to improve transparency and make results more reproducible.”
“Appointed in July last year, geneticist Dr Skipper has said that reproducible science is a priority for her tenure. But she stopped short of saying Nature – one of a handful of highly selective multidisciplinary journals perceived to give academic careers a major boost – would actually make data deposition mandatory, although she did say that it was piloting a platform where authors could share source code.”
To read the article, click here.
[From the introductory editorial “Moving to a World Beyond ‘p < 0.05’” by Ronald Wasserstein, Allen Schirm and Nicole Lazar, published in The American Statistician]
“Some of you exploring this special issue of The American Statistician might be wondering if it’s a scolding from pedantic statisticians lecturing you about what not to do with p-values, without offering any real ideas of what to do about the very hard problem of separating signal from noise in data and making decisions under uncertainty. Fear not. In this issue, thanks to 43 innovative and thought-provoking papers from forward-looking statisticians, help is on the way.”
“There’s not much we can say here about the perils of p-values and significance testing that hasn’t been said already for decades… If you’re just arriving to the debate, here’s a sampling of what not to do:”
— “Don’t base your conclusions solely on whether an association or effect was found to be “statistically significant” (i.e., the pvalue passed some arbitrary threshold such as p < 0.05).”
– “Don’t believe that an association or effect exists just because it was statistically significant.”
– “Don’t believe that an association or effect is absent just because it was not statistically significant.”
– “Don’t believe that your p-value gives the probability that chance alone produced the observed association or effect or the probability that your test hypothesis is true.”
– “Don’t conclude anything about scientific or practical importance based on statistical significance (or lack thereof).”
…
“The editors of this special TAS issue on statistical inference asked all the contact authors to help us summarize the guidance they provided in their papers by providing us a short list of do’s. We asked them to be specific but concise and to be active— start each with a verb.”
“Here is the complete list of the authors’ responses, ordered as the papers appear in this special issue. …”

You must be logged in to post a comment.