[From the article “A Waste of 1,000 Research Papers” by Ed Yong, published in The Atlantic]
“In 1996, a group of European researchers found that a certain gene, called SLC6A4, might influence a person’s risk of depression. It was a blockbuster discovery at the time. “
“Over two decades, this one gene inspired at least 450 research papers.”
“But a new study—the biggest and most comprehensive of its kind yet—shows that this seemingly sturdy mountain of research is actually a house of cards, built on nonexistent foundations.”
“‘We didn’t find a smidge of evidence,’ says Matthew Keller, who led the project.”
“‘This should be a real cautionary tale,’ Keller adds. ‘How on Earth could we have spent 20 years and hundreds of millions of dollars studying pure noise?'”
“Many fields of science, from psychology to cancer biology, have been dealing with similar problems: Entire lines of research may be based on faulty results. The reasons for this so-called reproducibility crisis are manifold.”
“Beyond a few cases of outright misconduct, these practices are rarely done to deceive. They’re an almost inevitable product of an academic world that rewards scientists, above all else, for publishing papers in high-profile journals—journals that prefer flashy studies that make new discoveries over duller ones that check existing work. People are rewarded for being productive rather than being right, for building ever upward instead of checking the foundations. These incentives allow weak studies to be published. And once enough have amassed, they create a collective perception of strength that can be hard to pierce.”
[From the article “This economics journal only publishes results that are no big deal: Here’s how that might save science” by Kelsey Piper, published in Vox]
“Most new publications, upon their launch, seek to promote their content as novel, surprising, exciting. A new journal that began publishing this week does … the opposite of that.”
“Start with the name: Series of Unsurprising Results in Economics (SURE). The journal publishes papers with findings that are, well, really boring — so boring that other journals rejected them just for being boring.”
“But before you close this tab, hear me out. SURE is actually far from boring, even if the papers it publishes are guaranteed to be, as the name implies, unsurprising. In fact, it’s a pretty big deal, and a significant step toward fixing a major problem with scientific research.”
“SURE exists to fight “publication bias,” which affects every research field out there.”
“Publication bias works like this: Let’s say hundreds of scientists are studying a topic. The ones who find counterintuitive, surprising results in their data will publish those surprising results as papers.”
“That makes sense — but it’s terrible for science. This tendency leads researchers to waste time on analyses that other researchers may have already pursued but not publicized; to twist their data for results so they can publish when they initially don’t find anything; and to look for surprising outliers instead of the often mundane reality.”
“But awareness about this problem is growing. And in response, scientists are trying to build better processes. SURE is one step toward that goal.”
[From an announcement on the BITSS website]
“Research Transparency and Reproducibility Training (RT2) provides participants with an overview of tools and best practices for transparent and reproducible social science research.”
“RT2 is designed for researchers in the social and health sciences, with particular emphasis on economics, political science, psychology, and public health. Participants are typically (i) current Masters and PhD students, (ii) postdocs, (iii) junior faculty, (iv) research staff, (v) librarians and data stewards, and (vi) journal editors, funders, and research managers curious about the implications of transparency and reproducibility for their work.”
“Applicants should have proficiency in R or Stata.”
“Tuition for RT2 is $1,500 for three days, including breakfast, lunch, and a networking reception on September 13.”
“For up to 30 participants, BITSS offers partial or full financial support by waiving the tuition fee and covering travel, lodging and child care.”
“To be considered for financial support, applications must be submitted no later than 11:59 pm PT June 2, 2019. Notifications of acceptance for applicants with financial support will be sent no later than June 14, 2019.”
Like many others, I was aware that there was controversy over null-hypothesis statistical testing. Nevertheless, I was shocked to learn that leading figures in the American Statistical Association (ASA) recently called for abolishing the term “statistical significance”.
In an editorial in the ASA’s flagship journal, The American Statistician, Ronald Wasserstein, Allen Schirm, and Nicole Lazar write: “Based on our review of the articles in this special issue and the broader literature, we conclude that it is time to stop using the term ‘statistically significant’ entirely.”
The ASA advertises itself as “the world’s largest community of statisticians”. For many who have labored through an introductory statistics course, the heart of statistics consists of testing for statistical significance. The fact that leaders of “the world’s largest community of statisticans” are now calling for abolishing “statistical significance” is jarring.
The fuel for this insurgency is an objection to dichotomous thinking: Categorizing results as either “worthy” or “unworthy”. P-values are viewed as complicit in this crime against scientific thinking because researchers use them to “select which findings to discuss in their papers.”
Against this the authors argue: “No p-value can reveal the plausibility, presence, truth, or importance of an association or effect. Therefore, a label of statistical significance does not mean or imply that an association or effect is highly probable, real, true, or important. Nor does a label of statistical nonsignificance lead to the association or effect being improbable, absent, false, or unimportant. For the integrity of scientific publishing and research dissemination, therefore, whether a p-value passes any arbitrary threshold should not be considered at all when deciding which results to present or highlight.”
Are p-values a gateway drug to dichotomous thinking? While the authors caution about the use of p-values, they stop short of calling for their elimination. In contrast, a number of prominent journals now ban their use (see here and here). Like many controversies in statistics, the issue revolves around causality. Does the use of p-values cause dichotomous thinking, or does dichotomous thinking cause the use of p-values?
Like it or not, we live in a dichotomous world. Roads have forks in them. Limited journal space forces researchers to decide which results to report. Limited attention spans force readers to decide which results to focus on. To suggest that eliminating p-values will change the dichotomous world we live in is to confuse correlation with causation. The relevant question is whether p-values are a suitable statistic for selecting among empirical findings.
Are p-values “wrong”? Given all the bad press about p-values, one might think that there was something inherently flawed about p-values. As in, they mismeasure or misrepresent something. But nobody has ever accused p-values of being “wrong”. P-values measure exactly what they are supposed to. Assuming that (1) one has correctly modelled the data generating process (DGP) and associated sampling procedure, and (2) the null hypothesis is correct, p-values tell one how likely it is to have estimated a parameter value that is as far away, or farther, from the hypothesized value as the one observed. It is a statement about the likelihood of observing particular kinds of data conditional on the validity of given assumptions. That’s what p-values do, and to date nobody has accused p-values of doing that incorrectly.
Do the assumptions underlying p-values render then useless? The use of single-valued hypotheses (such as the null hypothesis) and parametric assumptions about the DGP certainly vitiate the validity and robustness of statistical inference, and p-values. However, this can’t be the main reason why p-values are objectionable. The major competitors to frequentist statistics, the likelihood paradigm and Bayesian statistics, also rely on single-valued hypotheses and parametric assumptions of the DGP. Further, for those bothered by the parametric assumptions underlying the DGP, non-parametric methods are available.
Do p-values answer the right question? Whether p-values are useful depends on the question one is trying to answer. Much, if not most, of estimation is concerned with estimating quantities, such as the size of the relationship between variables. In contrast, the most common use of p-values is to determine the existence of a relationship. However, the two are not unrelated. In measuring a quantity, it is natural to ask whether the relationship really exists or, alternatively, whether the observed relationship is the result of random chance.
It is precisely on the question of existence where the controversy over p-values enters. P-values are not well-suited to determine existence. Wasserstein, Schirm, and Lazar state: “No p-value can reveal the plausibility, presence, truth, or importance of an association or effect.” Technically, p-values report probabilities about observing certain kinds of data conditional on an underlying hypothesis being correct. They do not report the probability that the underlying hypothesis is correct.
This is true. Kind of. And therein lies the rub. Consider the following thought experiment: Imagine you run two regressions. In the first regression, you regress Y on X1 and test whether the coefficient on X1 equals 0. You get a p-value of 0.02. In the second regression, you regress Y on X2 and test whether the coefficient on X2 equals 0. You get a p-value of 0.79. Which variable is more likely to have an effect on Y? X1 or X2?
If you respond by saying that you can’t answer that question because “No p-value can reveal the plausibility, presence, truth, or importance of an association or effect”, I am going to say that I don’t believe you really believe that. Yes – the p-value is a probability about the data, not the hypothesis. Yes – if the coefficient equals zero, you are just as likely to get a p-value of 0.02 as 0.79. Yes – the coefficient either equals zero or it doesn’t equal zero, and it almost certainly does not equal exactly zero, so both null hypotheses are wrong. But if you had to make a choice, even knowing all that, I contend that most researchers would choose X1. And not without reason.
In the long run, performing many tests, they are more likely to be correct if they choose the variable with the lower p-value. Further, experience tells them that variables with low p-values generally have more substantial effects than variables with high p-values. So while it is difficult to know exactly what p-values have to say about the tested hypothesis, they say something. In other words, p-values contain information about the probability that the tested hypothesis is true.
For purists who can’t bring themselves to admit this, consider some further arguments. In deciding between two competing hypotheses, Bayes factors are commonly used as evidence for/against the null hypothesis versus an alternative. But there is a one-to-one mapping between Bayes factors and p-values. Logic dictates that if Bayes factors contain evidentiary information about the null hypothesis, and p-values map one-to-one to Bayes factors, then p-values must also contain evidentiary information about the null hypothesis.
But wait, there’s more! A recent simulation study published in the journal Meta-Psychology used “signal detection theory” to compare a variety of approaches for distinguishing “signals” from “no signals”. It concluded: “…p-values were effective, though not perfect, at discriminating between real and null effects” (Witt, 2019). Consistent with that, recent studies on reproducibility have found that a strong predictor of replication success is the p-value reported in the original study (Center for Open Science, 2015; Altmejd et al., 2019).
Taken together, I believe the arguments above make a compelling case that p-values contain information in discriminating between real and spurious empirical findings, and that this information can be useful in selecting variables.
P-values are useful, but how useful? Unfortunately, while p-values contain information about the existence of observed relationships, the specific content of that information is not well defined. Not only is the information ill-defined, but the measure itself is a noisy one: In a given application, the range of observed p-values can be quite large. For example, if the null hypothesis is true, the distribution of p-values will be uniform over [0,1]. Thus one is just as likely to obtain a p-value of 0.02 as 0.79 if there is no effect.
Further complicating the interpretation of p-values is the fact that the computation of a p-value assumes a particular DGP, and this DGP is almost certainly never correct. For example, statistical inference typically assumes that the population effect is homogeneous. Specifically, it assumes the effect is the same for all the subjects in the sample, and the same for the subjects in the sample and the associated population. It is highly unlikely that this would ever be correct when human subjects are involved. If the underlying population effects are heterogeneous, p-values will be “too small”, and so will the associated confidence intervals.
Conclusion. We live in a dichotomous world. Banning statistical inference will not change that. Limited journal space and limited attention spans mean that researchers will always be making decisions about which results to report, and which results to pay attention to. P-values can help researchers make those decisions.
That being said it, it should always be remembered that p-values are noisy indicators and should not be overly relied upon. The evidentiary value of a p-value = 0.04 is practically indistinguishable from a p-value = 0.06. In contrast, the evidentiary value against the null hypothesis is stronger for a p-value = 0.02 compared to a p-value = 0.79. How much stronger? That is not clear. Statistics can only take us so far.
P-values should be one part, but only one part, of a larger suite of estimates and analyses that researchers use to learn from data. Statisticians and their ilk could do us a real service by providing greater guidance on how best to do that. The discussion about statistical inference and p-values would profit by veering more in this direction.
Bob Reed is a professor of economics at the University of Canterbury in New Zealand. He is also co-organizer of the blogsite The Replication Network. He can be contacted at bob.reed@canterbury.ac.nz.
IREE (the International Journal for Re-Views in Empirical Economics) was launched in September 2017, supported by our prestigious board of academic advisors: Sir Angus Deaton, Richard Easterlin, and Jeffrey Wooldridge. It is the first, and, to date, only journal solely dedicated to publishing replication studies in Economics. As we take stock of where we currently are, I want to take this opportunity to provide an update, and to talk about four areas that will be crucial for IREE’s growth in the future: financing, publications, submissions, and the editorial board.
Financing of IREE
We currently live in a time of major upheaval in academic publishing. Plan S and Project DEAL represent major challenges to the “big publisher/closed access” model that has dominated academic publishing. IREE is part of a new movement in academic publishing that emphasizes open access. All of our content is available online, free of charge, and authors are not charged a submission fee. This is in keeping with the philosophy of “Open Science”, which fits naturally with our focus on replication.
So who pays our bills? Funding of IREE is provided by the Joachim Herz Foundation and the ZBW – Leibniz Information Centre for Economics. While the funding has allowed us to get this far, we are currently seeking to strengthen our foundation of financial support by building a consortium of supporting institutions including universities, central banks, research institutes and libraries from all over the world. To do that, we need to establish a solid track record of publishing high quality and important replication studies. This brings us to our next category.
Publications in IREE
We have been pleased with the quality of the replication studies we have published to date. Our list of published studies include replications of research that has appeared in the American Economic Review, the Quarterly Journal of Economics, the American Economic Journal: Applied Economics, the Review of Economics and Statistics, the Oxford Bulletin of Economics and Statistics, and other prestigious journals. Publications in IREE are distributed via EconStor, RePEc, and the ReplicationWiki. You can check out our publications here.
Submissions to IREE
Quality submissions are the lifeblood of the journal, and the key to us securing future funding. We need the quality replication studies to keep coming in. While we are always pleased to receive submissions from prominent, established researchers, we are also happy to receive submissions from post-graduate students and early career researchers.
Many PhD programs have students perform replications as part of their graduate coursework and empirical training. These should consider IREE as a publication outlet. Our quick review times and online publishing means that it is possible for students to have their work published and “in print” by the time they enter the job market, helping to establish their research record.
A distinctive feature of IREE is that we publish quality replications regardless of the outcome. There are other journals that publish replication studies, but oftentimes they will only publish a replication if it is overturns the results of an original study. For example, the American Economic Review has published many replication studies, but all of their replications disconfirm the original studies. IREE will publish a replication study even if the results of that analysis support the findings of the original research.
IREE specializes in the following areas: Microeconomics, Macroeconomics, Experiments, and Finance/Management/Business Administration. We also accept replication studies from adjacent disciplines that are closely related to economics. Please check out our “Aims and Scope”.
Editorial Board of IREE
Along with our growth has come some changes in our editorial board. Hilmar Schneider and Gert G. Wagner, who both helped to found IREE, have since left. Many thanks to both! Martina Grunow and Joachim Wagner are now supported by the new editors Maren Duvendack and Christian Pfeifer. Furthermore, we are very grateful for the active, critical and enthusiastic help from our great co-editors (see here).
In conclusion, please consider supporting open science and replication in economics by submitting your replication research to IREE. Further, if you have colleagues and students who have done replication research, please encourage them to submit their work to IREE.
Follow IREE on Twitter: @IreeJournal.
Dr. Martina Grunow is Managing Editor of the International Journal for Re-Views in Empirical Economics (IREE) and is an associate researcher at the Canadian Centre for Health Economics (CCHE). She can be contacted by email at m.grunow@zbw.eu.
[From the preprint “An empirical assessment of transparency and reproducibility-related research practices in the social sciences (2014-2017)” by Tom Hardwicke, Joshua Wallach, Mallory Kidwell, & John Ioannidis posted at MetaArXiv Preprints]
“In this study, we evaluated a broad range of indicators related to transparency and reproducibility in a random sample of 198 articles published in the social sciences between 2014 and 2017.”
“…sample characteristics are displayed in Table 2.”
“Among the 198 eligible articles, 95…had a publicly available version (Fig. 1A) whereas 84…were only accessible to us through a paywall, …19…additional articles were not available to our team, highlighting that even researchers with broad academic access privileges cannot reach portion of the scientific literature.”
“Raw data are the core evidence that underlies scientific claims. However, the vast majority of 103 articles we examined did not contain a data availability statement (Fig. 1D). Eight articles stated that they had used an external data source but it was unclear if the data were available. Among a further 8…datasets that were reportedly available, 2 were reportedly ‘available upon request’ from the authors and 2 had broken links to supplementary materials and a personal/institutional webpage. Of the 4 accessible datasets…2 were both incomplete and not clearly documented.” 
“Analysis scripts provide detailed step-by-step descriptions of performed analyses, often in the form of computer code (e.g., R, Python, or Matlab) or syntax (SPSS, Stata, SAS). Although 3 of 103 … articles reported that analysis scripts were available (Fig. 1E), 1 of these involved a broken link to journal-hosted supplementary information and 1 was only “available on request”, which we did not attempt to confirm. The 1 available analysis script was provided in journal-hosted supplementary information.”
“Replication studies repeat the methods of previous studies in order to systematically gather evidence on a given research question. Evidence gathered across multiple relevant studies can be formally collated and synthesized through systematic reviews and meta-analyses. Only 2 of the 103 … articles we examined explicitly self-identified as a replication study.”
“Pre-registration refers to the archiving of a read-only, time-stamped study protocol in a public repository (such as the Open Science Framework) prior to study commencement….None of the articles specified that the study was pre-registered…”
“Our empirical assessment of a random sample of articles published between 2014 and 2017 suggests a serious neglect of transparency and reproducibility in the social sciences. Most research resources, such as materials, protocols, raw data, and analysis scripts, were not explicitly available, no studies were pre-registered, disclosure of funding sources and conflict of interests was modest, and replication or evidence synthesis via meta-analysis or systematic review was rare.”
To read the article, click here.
[From the blog “Don’t Put Too Much Meaning Into Control Variables” by Paul Hünermund, posted at his website, p-hunermund.com]
“It’s commonplace in regression analyses to not only interpret the effect of the regressor of interest, D, on an outcome variable, Y, but also to discuss the coefficients of the control variables. Researchers then often use lines such as: “effects of the controls have expected signs”, etc. And it probably happened more than once that authors ran into troubles during peer-review because some regression coefficients where not in line with what reviewers expected.”
“… coefficients of control variables do not necessarily have a structural interpretation. Take the following simple example:”

“If we’re interested in estimating the causal effect of X on Y … it’s entirely sufficient to adjust for W1 in this graph. …However, if we estimate the right-hand side, for example, by linear regression, the coefficient of W1 will not represent its effect on Y. It partly picks up the effect of W2 too, since W1 and W2 are correlated.”
“If we would also include W2 in the regression, then the coefficients of the control variables could be interpreted structurally and would represent genuine causal effects. But in practice it’s very unlikely that we’ll be able to measure all causal parents of Y. The data collection efforts could just be too huge in a real-world situation.”
“But that also implies that the coefficients of controls lose their substantive meaning, because they now represent a complicated weighting of several causal influence factors. … if they don’t have expected signs, that’s not a problem.”
[From the editorial “SA Editorial About Next Phase of More Open Science” by Michael Seto, published in the journal Sexual Abuse]
“It is now widely recognized that there are publication biases toward novel and exciting findings, which has contributed to a replication crisis in the social sciences. In brief, large-scale efforts to replicate social science findings have revealed that a shocking percentage fail to replicate (see here and here). Publication bias discourages reporting of null results and reporting of straight-forward replication attempts. It is increasingly clear that we need to encourage replication.”
“Responding to concerns about replication, Sanjay Srivastava wrote a blogpost in 2012 regarding a “Pottery Barn rule” for journals (“if you break it, you bought it”), wherein journals take responsibility for the replicability of research it publishes by encouraging replication attempts.”
“One way to encourage replication attempts is to provide a peer-reviewed outlet for these attempts, whether or not they were successful. This idea has been taken up by some journals. It was introduced to the Royal Society Open Access journal, as described in this blogpost. and Psychological Science, a flagship journal of the Association for Psychological Science, also offers the option of replication reports, but only if preregistered.”
“We are therefore introducing brief replication reports as a new format for manuscripts describing the results of an attempt to replicate studies previously published in this journal.”
“We believe the replication report could be a particularly attractive option for file-drawered studies where replication attempts did not find statistically significant results and therefore were not submitted for publication or for student-led research where an attempt to replicate a previous study sets the stage for their original work.”
[From the blog “Better pre-analysis plans through design declaration and diagnosis” by Graeme Blair, Jasper Cooper, Alexander Coppock, and Macartan Humphreys, posted at BITSS]
“Pre-analysis plans (PAPs) are used by researchers to register a set of analyses before they learn about outcomes. PAPs clarify which choices were made before observing outcomes and which were made afterwards. Ironically, the set of decisions that should be specified in a PAP is itself remarkably unclear.”
“We propose an approach that clarifies what might belong in a PAP by placing design declaration at the core of a pre-analysis plan. In particular, we propose that PAPs include, in addition to other details:”
– “A declaration (in code) of the features of a design.”
– “A design diagnosis that analyzes the properties of the design such as power, bias, or coverage via Monte Carlo simulations.”
“By “declaration” we mean a formal statement of the questions a design seeks to answer and the strategies for answering them. There should be enough information to simulate the implementation of the design.”
“A model, M, of how the world works. We are used to specifying expected effect sizes and sample sizes for power calculations, but this leaves out many aspects of the design – the pre-treatment variables and their distributions, expected heterogeneity in effect sizes, the structure of clustering in the data, and other details consequential for assessments of power and other properties.”
“An inquiry, I, about the distribution of variables, perhaps given interventions on some variables. The average treatment effect or the average level of support for a political candidate are common inquiries.”
“A data strategy, D, is how you as the researcher intervene in the world to change outcomes and generate data. This includes case selection (or sampling decisions) and measurement, as well as interventions such as assignment of treatments.”
“An answer strategy, A, that uses data to generate an answer. The answer strategy includes not only regression models and other numerical summaries of the data, but also the tables and figures based on those models.”
“If all four of these elements are declared, then it can become possible to “run” the design and to see how well it answers questions.”
“As an illustration, we describe a design that seems well-defined, but for which diagnosis reveals that the question itself is poorly formed.”
“Designs can be declared in many coding languages. The DeclareDesign software packages streamlines this process for R users, as illustrated below.”
“But you don’t have to use our package to do this. To illustrate, we declare the design in three additional code languages: Stata, Python, and via formulae in Excel.”
[This Guest Blog is a repost of a blog by Markus Eberhardt, published at Vox – CEPR Policy Portal]
Recent evidence suggests that a country switching to democracy achieves about 20% higher per capita GDP over subsequent decades. This column demonstrates the sensitivity of these findings to sample selection and presents an implementation which generalises the empirical approach. If we assume that the democracy– growth nexus can differ across countries and may be distorted by common shocks or network effects, the average long-run effect of democracy falls to 10%.
In a recent paper, Acemoglu et al. (2019), henceforth “ANRR”, demonstrated a significant and large causal effect of democracy on long-run growth. By adopting a simple binary indicator for democracy, and accounting for the dynamics of development, these authors found that a shift to democracy leads to a 20% higher level of development in the long run.1
The findings are remarkable in three ways:
– Previous research often emphasised that a simple binary measure for democracy was perhaps “too blunt a concept” (Persson and Tabellini 2006) to provide robust empirical evidence.
– Positive effects of democracy on growth were typically only a “short-run boost” (Rodrik and Wacziarg 2005).
– The empirical findings are robust across a host of empirical estimators with different assumptions about the data generating process, including one adopting a novel instrumentation strategy (regional waves of democratisation).
ANRR’s findings are important because, as they highlight in a column on Vox, there is “a belief that democracy is bad for economic growth is common in both academic political economy as well as the popular press.” For example, Posner (2010) wrote that “[d]ictatorship will often be optimal for very poor countries”.
The simplicity of ANRR’s empirical setup, the large sample of countries, the long time horizon (1960 to 2010), and the robust positive – and remarkably stable – results across the many empirical methods they employ send a very powerful message against such doubts that democracy does cause growth.
I agree with their conclusion, but with qualifications. My investigation of democracy and growth (Eberhardt 2019) captures two important aspects that were assumed away in ANRR’s analysis:
– Different countries may experience different relationships between democracy and growth. Existing work (including by ANRR) suggests that there may be thresholds related to democratic legacy, or level of development, or level of human capital, or whether the democratisation process was peaceful or violent. All may lead to differential growth trajectories.2
– The world is a network. It is subject to common shocks that may affect countries differently. The Global Crisis is one example, as are spillovers across countries (Acemoglu et al. 2015, in the case of financial networks).
Robustness of ANRR’s findings
One way in which these features could manifest themselves in ANRR’s findings would be if their democracy coefficient differed substantially across different samples. I carried out two sample reduction exercises:
– Since their panel is highly unbalanced, I drop countries by observation count, first those countries which possess merely five observations, then those with six, and so on.
– I adopt a standard strategy from the time series literature, shifting the end year of the sample. I drop 2010, then 2009-2010, and so on. This strategy is also justified because the Global Crisis and its aftermath, the biggest global economic shock since the 1930s, occurs towards the end of ANRR’s sample. Clearly it may affect the data on the democracy-growth nexus.3
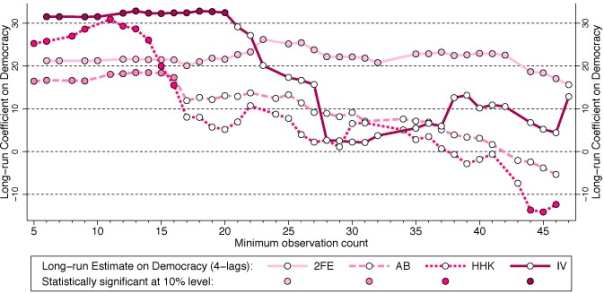
Figures 1a and 1b present the findings from these exercises for four parametric models, using the preferred specification of ANRR.
Figure 1. Robustness of ANRR’s findings
(a) Sample reduction by minimum observation count
(b) Sample reduction by end year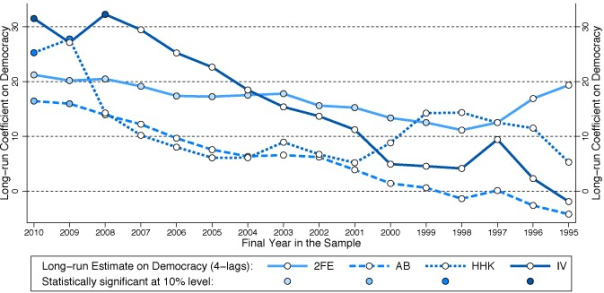
Notes: All estimates are for the specification with four lags of GDP (and four lags of the instrument for 2SLS) preferred by ANRR. The left-most estimates in panel (a) replicate the results in ANRR’s Table 2, column (3) for 2FE, (7) for AB, and (11) for HHK (Hahn et al. 2001), and Table 6, column (2) Panel A for 2SLS (two-stage least squares). The left-most estimates in panel (b) replicate the results in ANRR’s Table 2, column (3) for 2FE, (7) for AB (Arellano and Bond 1991), and (11) for HHK, and Table 6, column (2) Panel A for 2SLS.
Taking, for instance, the IV results in Figure 1a,4 it can be seen that long-run democracy estimates are initially statistically significant (indicated by a filled circle), in excess of 30% in magnitude, and stable – note that the left-most estimate is the full sample one which replicates the result of ANRR.
However, once I exclude any country with fewer than 21 time series observations, the long-run coefficient turns statistically insignificant (indicated by a hollow circle). Further sample reduction results in a substantial drop in the coefficient magnitude. The results for all other estimators, and those in Figure 1b, can be read in the same way, although in Figure 1b moving to the right means moving the sample end year forward in time.
We can conclude that the fixed effects estimates are stable. But those of all other estimators vary substantially, typically dropping off towards (or even beyond) zero as the sample is constrained. Of course empirical results change when the sample changes, but the omitted observations are relatively unsubstantial, relative to the overall sample size. For the IV results:
– dropping either 3% (Figure 1b) or 7% (Figure 1a) of observations leads to an insignificant long-run coefficient;5
– dropping either 18% (Figure 1a) or 27% (Figure 1b) of observations leads to a long-run coefficient on democracy below 5% in magnitude (the full sample coefficient is 31.5%).
If we purposefully mine the sample for influential observations, and omit Turkmenistan (never a democracy), the Ukraine (democratic in 17 out of 20 sample years), and Uzbekistan (never a democracy), which provide 60 observations or 0.95% of the full ANRR sample, this yields a statistically insignificant long-run democracy coefficient for the IV implementation.
However, we can also substantially boost the IV estimate by adopting the balanced panel employed in a separate exercise by Chen et al. (2019). These authors study the FE and Arellano and Bond (1991) implementations by ANRR, and conclude that correcting for the known biases afflicting these estimators does not substantially change the long-run democracy coefficient. If I estimate ANRR’s IV estimator for the same balanced panel the long-run democracy coefficient is almost 180%, roughly six times that of the full sample result.
New findings
These exercises highlight that ANRR’s results are sensitive to sample selection. I argue that spillovers between – or heterogeneous democracy-growth relationships across – countries are at the source of this fragility. This violates the basic assumptions of the set of methods used by ANRR, and so it calls for different empirical estimators.
I therefore employ recently developed estimators from the impact evaluation literature (Chan and Kwok 2018) that study the effect of democratisation in the sub-sample of countries for which the democracy indicator changed during the sample period. Chan and Kwok’s approach accounts for endogenous selection into democracy, as well as uncommon and stochastic trends, by including cross-section averages of the subsample of countries that never experienced democracy in the estimation equation.
Since ANRR’s results are all based on dynamic specifications (models including lags of the dependent variable) I adjust the methodology to incorporate this feature, and present long-run democracy estimates, as ANRR did. Subjecting this methodology to the same sample reduction exercises as above gives the results in Figure 2.
Figure 2. Employing heterogeneous parameter estimators
(a) Sample reduction by minimum observation count
(b) Sample reduction by end year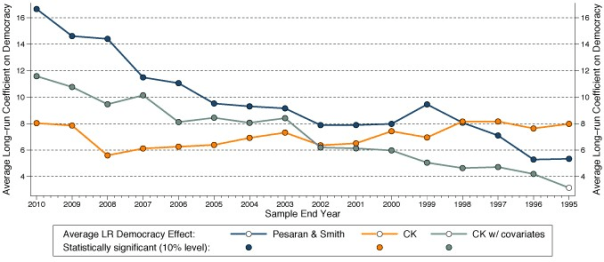
Comparing the results of the preferred specification from Chan and Kwok (incorporating covariates – the teal-coloured line and circles in the figures) and of ANRR’s IV estimation my findings suggest that the full sample average long-run democracy effect across countries is more modest than that found in ANRR, at around 12% compared to 31.5%. Although Chan and Kwok’s estimates vary when the sample is reduced, the democracy coefficient remains statistically significant, the magnitude substantial, and, at least for the first exercise in Figure 2a, remarkably stable.6
The democratic dividend
The implicit conclusion from pooled empirical analysis as presented in ANRR is that the 20% democratic dividend applies to any country. This interpretation was perhaps not even intended by the authors but, as my empirical exercises demonstrate, their empirical implementations are compromised if the growth effect of democracy differs across countries.
Once we shift to a heterogeneous model, the long-run democracy effect averaged across countries is more modest. The most important question for future research is what drives the differential magnitude of this effect across countries. My initial investigations suggest that democratic legacy is not a prerequisite for a positive democracy effect, but the relationship between the democratic dividend and initial levels of literacy (as a proxy for human capital) appears to follow a U-shape.
Markus Eberhart is an Associate Professor in the School of Economics, University of Nottingham, and a Research Affiliate at the Center for Economic and Policy Research (CEPR).
References
Acemoglu, D, S Naidu, P Restrepo, and J A Robinson (2019), “Democracy Does Cause Growth”,Journal of Political Economy 127(1): 47-100.
Acemoglu, D, A Ozdaglar, and A Tahbaz-Salehi (2015), “Systemic risk and stability in financial networks”, American Economic Review 105(2): 564–608.
Aghion, P, A Alesina, and F Trebbi (2008), “Democracy, Technology, and Growth”, in E Helpman (ed,) Institutions and Economic Performance, Harvard University Press.
Arellano, M, and S R Bond (1991), “Some tests of specification for panel data: Monte Carlo evidence and an application to employment equations”, Review of Economic Studies 58(2): 277-297.
Cervellati, M, and U Sunde (2014), “Civil Conflict, Democratization, and Growth: Violent Democratization as Critical Juncture”, Scandinavian Journal of Economics 116(2): 482-505.
Eberhardt, M, and F Teal (2011), “Econometrics for grumblers: a new look at the literature on cross-country growth empirics”, Journal of Economic Surveys 25(1): 109-155
Gerring, J, P Bond, W T Barndt, and C Moreno (2005), “Democracy and economic growth: A historical perspective”, World Politics 57(3): 323-364.
Hahn, J, J A Hausman, and G Kuersteiner (2001), “Bias Corrected Instrumental Variables Estimation for Dynamic Panel Models with Fixed Effects”, MIT Department of Economics Working Paper 01-24.
Madsen, J B, P A Raschky, and A Skali (2015), “Does democracy drive income in the world, 1500- 2000?”, European Economic Review 78: 175-195.
Papaioannou, E, and G Siourounis (2008), “Democratisation and growth’, Economic Journal 118(532): 1520-1551.
Persson, T, and G Tabellini (2006), “Democracy and development: The devil in the details”, American Economic Review, Papers & Proceedings 96(2): 319-324.
Rodrik, D, and R Wacziarg (2005), “Do democratic transitions produce bad economic outcomes?’, American Economic Review, Papers & Proceedings 95(2): 50-55.
Endnotes
[1] I follow the practice of ANRR in using ‘growth’ as a short-hand for economic development (the level of per capita GDP). The term ‘cross-country growth regression’ is a misnomer, given that the standard specification represents a dynamic model of the levels of per capita GDP; see Eberhardt and Teal (2011) for a more detailed discussion of growth empirics.
[2] Gerring, et al (2005) for democracy legacy, Aghion, et al (2008) and Madsen, et al (2015) for thresholds, finally Cervellati and Sunde (2014) for concerns related to democratisation scenarios.
[3] Note that shifting the start year of the sample does not result in any substantial changes in ANRR’s result: it is the experience of the post-2000 period which drives their results.
[4] The AB and HHK results are arguably less robust than the IV results to sample restrictions.
[5] For comparison, in related work on democratisation and growth Papaioannou and Siourounis (2008) show the robustness of their findings using a cut-off equivalent to 12% of their full sample.
[6] One would expect that the temporal sample reduction as presented in Figure 4 would slowly chip away at the magnitude of the coefficient.


You must be logged in to post a comment.