[From the preprint “Accumulation bias in meta-analysis: the need to consider time in error control” by Judith ter Schure and Peter Grünwald, posted at arXiv.org]
“Studies accumulate over time and meta-analyses are mainly retrospective. These two characteristics introduce dependencies between the analysis time, at which a series of studies is up for meta-analysis, and results within the series.”
“Dependencies introduce bias — Accumulation Bias — and invalidate the sampling distribution assumed for p-value tests, thus inflating type-I errors.”
“…by using p-value methods, conventional meta-analysis implicitly assumes that promising initial results are just as likely to develop into (large) series of studies as their disappointing counterparts. Conclusive studies should just as likely trigger meta-analyses as inconclusive ones. And so the use of p-value tests suggests that results of earlier studies should be unknown when planning new studies as well as when planning meta-analyses.”
“Such assumptions are unrealistic… ignoring these assumptions invalidates conventional p-value tests and inflates type-I errors.”
“… we argue throughout the paper that any efficient scientific process will introduce some form of Accumulation Bias and that the exact process can never be fully known.”
“A likelihood ratio approach to testing solves this problem … Firstly, it agrees with a form of the stopping rule principle … Secondly, it agrees with the Prequential principle … Thirdly, it allows for a betting interpretation …: reinvesting profits from one study into the next and cashing out at any time.”
“This leads to two main conclusions. First, Accumulation Bias is inevitable, and even if it can be approximated and accounted for, no valid p-value tests can be constructed. Second, tests based on likelihood ratios withstand Accumulation Bias: they provide bounds on error probabilities that remain valid despite the bias.”
[From the paper “Calibrating the scientific ecosystem through meta-research” by Tom Hardwicke, Stylianos Serghiou, Perrine Janiaud, Valentin Danchev, Sophia Crüwell, Steven Goodman, and John Ioannidis, forthcoming in Annual Review of Statistics and Its Application]
“Meta-research has been defined as ‘the study of research itself: its methods, reporting, reproducibility, evaluation, and incentives.'”
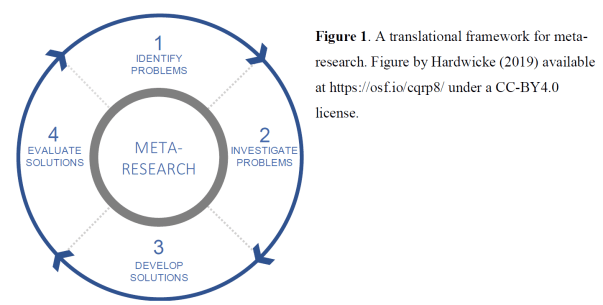
“We will map the endeavor of meta-research using the translational framework depicted in Figure 1. This framework is not necessarily comprehensive and aims to be descriptive rather than prescriptive. The goal is to highlight how individual meta-research projects form part of a broader effort to continuously calibrate the scientific ecosystem towards higher standards of efficiency, credibility, and quality.”
Outline
1. IDENTIFYING PROBLEMS
1.1 Incentives and norms
1.2 Lack of transparency
1.3 Statistical schools of thought and statistical misuse
1.4 Reproducibility
2. INVESTIGATING PROBLEMS
2.1 Incentive structures
2.2 Publication bias and selective reporting
2.3 Transparency of research resources
2.4 Suboptimal research design
2.5 Statistical misuse
2.6 Reproducibility
3. DEVELOPING SOLUTIONS
3.1 Journal, funder, society and university policies
3.2 Pre-registration and registered reports
3.3 Reporting guidelines
3.4 Peer review
3.5 Collaboration
3.6 Statistical reform
3.7 Evidence synthesis
4. EVALUATION SOLUTIONS
4.1 Journal policy
4.2 Reporting guidelines
4.3 Pre-registration and registered reports
To read the article, click here.
[From the presentation slides on “Replication and Reproducibility in Social Sciences and Statistics: Context, Concerns, and Concrete Measures” by Lars Vilhuber, AEA Data Editor, presented at the 2019 Western Economics Association International meetings]
NOTE: Just so there is no misunderstanding, this is NOT an official update from Lars Vilhuber via The Replication Network. Any and all updates will come from official AEA channels. Rather, these are excerpts from the publicly posted slides Professor Vilhuber made available for his talk at the WEAI meetings. TRN apologizes if the title of this post misled readers to think otherwise.
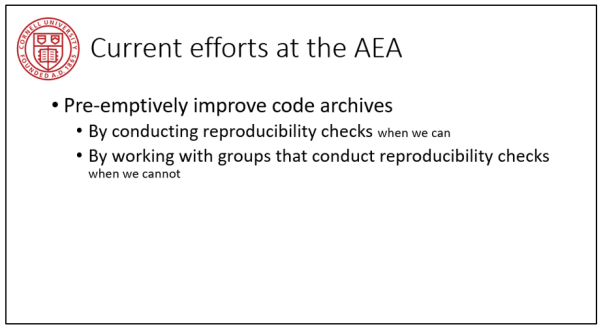
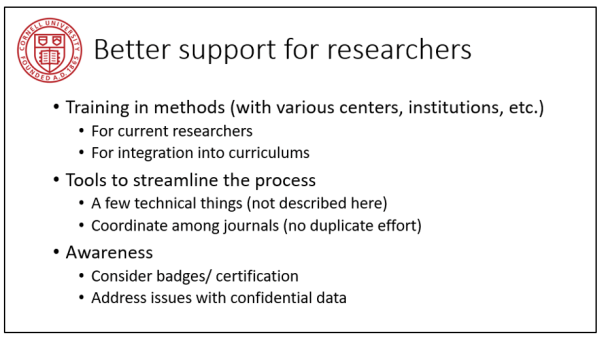
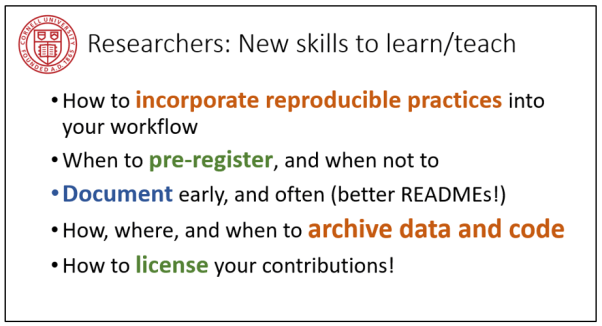
“In this talk, I describe the context in which the current discussion in the social science is occurring: what are the definitions of replicability and reproducibility, what is failing, and to what extent. In particular, I discuss the concerns in economics: to what extent is this a problem in economics, what are the approaches that are being considered, and what are the possible broader implications of those approaches. Finally, I discuss the concrete measures that are being implemented under my guidance at the American Economic Association, and that are being discussed in the broader economics community.”
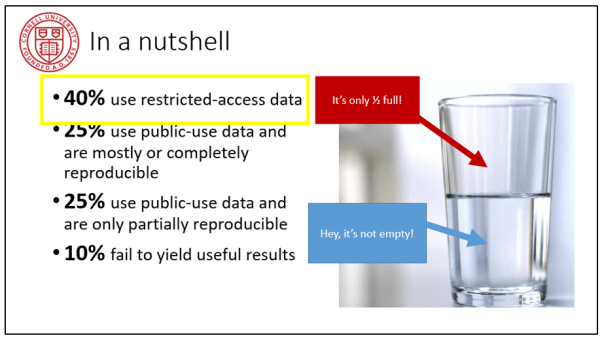
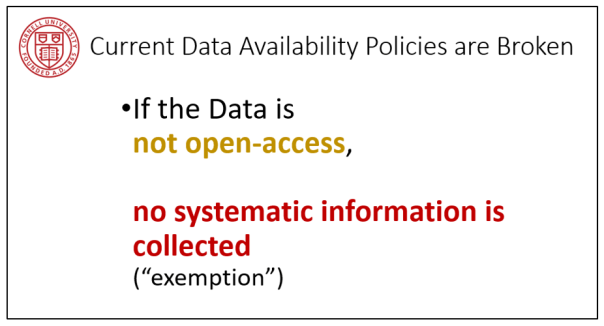
Selected slides







To see the full presentation, click here.
[From the article “Second-Guessing Predictions: When to trust scientific predictions—and when to ignore them” by Alexander Danvers]
“One of the key reforms of the Credibility Revolution in psychology research is the use of preregistration: Scientists write down what they predict will happen in an experiment beforehand, so there’s a record which other scientists and the public can look at when evaluating their work.”
“Unfortunately, in psychology, I and many other young researchers were taught a model of manuscript writing based on a famous book chapter by psychologist Daryl Bem called ‘Writing the Empirical Journal Article.'”
“Bem argues that you should write the article around the most interesting results you can find once you have analyzed your data, minimizing or abandoning what your experiment was originally designed to test if needed.”
“More thoughtful and prominent psychologists than me have already written about how this can undermine the scientific process, especially when the researcher then writes up the new result as if it was the main point of their study all along.”
“This is referred to as HARK-ing, or Hypothesizing After the Results are Known (HARK), and it is deceitful. … It’s like shooting at the barn door and then drawing a bullseye around wherever you hit.”
“But something has always nagged me about this argument about Bem’s article. …If a theory can be made compatible with almost any result, how could I have ever used it to make predictions in the first place? … I would argue that you should not care about my prediction. You, therefore, should not care about my preregistration.”
“As long as researchers are writing their manuscripts in the language of prediction—my theory predicted this result—we will need preregistration to keep ourselves honest.”
“But as long as we need preregistration to prove what a theory really predicted, we won’t be dealing with very deep theories. The next step in the Credibility Revolution might just be a step away from theory, and towards description.”
[* EIR = Econometrics in Replications, a feature of TRN that highlights useful econometrics procedures for re-analysing existing research. The material for this blog is motivated by a recent blog at TRN, “The problem isn’t just the p-value, it’s also the point-null hypothesis!” by Jae Kim and Andrew Robinson]
In a recent blog, Jae Kim and Andrew Robinson highlight key points from their recent paper, “Interval-Based Hypothesis Testing and Its Applications to Economics and Finance” (Econometrics, 2019). They identify three problems with conventional null hypothesis significance testing (NHST) based on p-values.
First, the p-value does not convey any information about the economic significance of the estimated effect.
Second, the p-value is decreasing in sample size for the same measured effect so that at a sufficiently large sample size, virtually everything is “statistically significant”.
Third, the null hypothesis is almost always wrong, as it unlikely in the extreme that a particular effect is truly 0.000000000…
As an alternative, they promote the use of interval-based hypothesis testing. In particular, they advance two types of interval tests: Minimum Effect Tests (MET) and Equivalence Tests (ET).
The idea behind the two tests is similar. In both cases, the researcher posits limits for a given effect. Say, in the judgment of the researcher, any effect that lies between value1 and value 2 is too small to be economically important. Only values outside this range are economically meaningful.
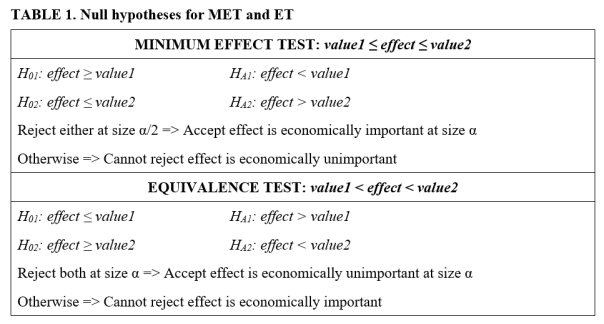
With Minimum Effect Tests, the aim is to determine if value1 ≤ effect ≤ value2. Hypothesis testing consists of two, one-sided hypothesis tests (TOST). H01: effect ≥ value1, and H02: effect ≤ value2. Rejection of either hypothesis leads to the conclusion that the effect is economically important. Otherwise one cannot reject the hypothesis that the effect is economically unimportant. The size of the MET test is the sum of the sizes of the two separate, one-sided t-tests.
With Equivalence Tests, the aim is to determine if value1 < effect < value2. Hypothesis testing again consists of two, albeit different, one-sided hypothesis tests (TOST): H01: effect ≤ value1 and H02: effect ≥ value2. Rejection of both hypotheses leads to the conclusion that the effect is economically unimportant. Otherwise one cannot reject the hypothesis that the effect is economically important. The size of the ET is the same as the size of the individual one-sided tests (which typically are of equal size).
This is summarized in the table below:
Given the above, it follows that the respective rejection criteria, expressed in terms of t-tests, are as reported in the table below.
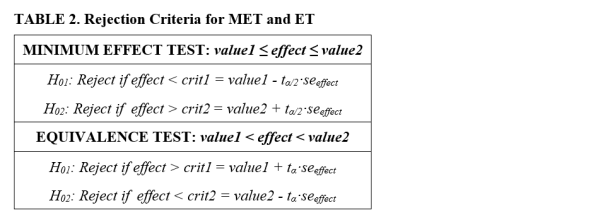
While similar, the two tests are designed for different purposes. Minimum Effect Tests are designed to test for economic importance, while Equivalence Tests are designed to test for lack of economic importance. Rejection of the respective null hypotheses allows one to accept the economic status for which the researcher is seeking evidence. This also means that the tests can lead to seemingly conflicting conclusions.
The remainder of this blog presents two examples to illustrate how to implement and interpret interval testing. In both examples, we envision an experiment with two groups, a treatment and a control group. The data generating process (DGP) used to produce the data is given by y = β·treat + error, where treat is a binary treatment variable that takes the value 1 if the subject received the treatment and 0 otherwise.
The examples are constructed so that in both cases the coefficient on the treat variable is statistically significant. Interval testing is used to determine whether the treatment effect is economically meaningful. To determine “economic importance”, we convert the estimated treatment effect to Cohen’s d, a familiar metric for measuring effect sizes when comparing means between two groups. Following the example of Lakens (2017), we interpret values of Cohen’s d less than 0.3 in absolute value to be economically unimportant.
Example One
The regression below reports the results of regressing the outcome variable y on the treatment dummy variable. 500 subjects receive the treatment, with another 500 held out for the control group. The treatment effect is significant at the 5% level, with a t-value of 2.23 (see below).
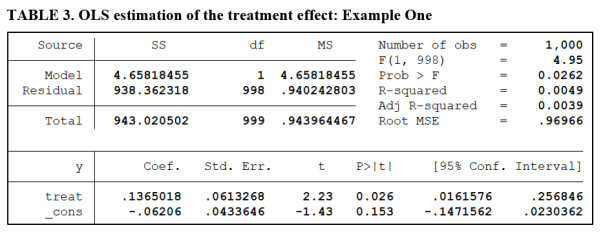
To implement interval testing, we test for differences in the means of the two groups, calculate Cohen’s d, and then carry out the respective tests of hypotheses as presented in Tables 1 and 2. The first example is constructed so that both the Minimum Effect Test and the Equivalence Test produce a similar conclusion. Table 4A reports the results for the MET.
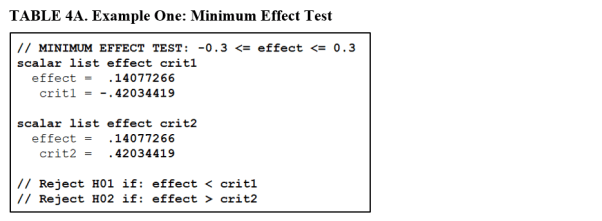
The estimated effect (Cohen’s d) is 0.14. The lower and upper critical values are ±0.42. We fail to reject both H01 and H02 for the Minimum Effect Test. According to Table 1, this leads to the conclusion that we cannot reject the hypothesis that the treatment effect is economically unimportant.
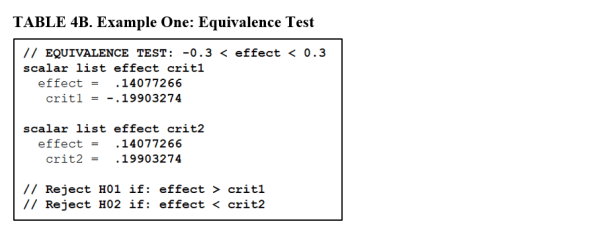
TABLE 4B reports the results of an Equivalence Test applied to the same data. Now we compare the Cohen’s d value of 0.14 to the critical values ±0.20. Accordingly, we reject both null hypotheses. This allows us to accept the hypothesis, at the 5% significance level, that the treatment does not have an economically important effect.
In this example, both tests lead to similar conclusions. However, there is an important difference. The Equivalence Test is the stronger result in that we accept the hypothesis of economic unimportance. The Minimum Effect Test is weaker, in that we only fail to reject the hypothesis that it is unimportant.
Example Two
In this example, we construct the DGP so that we still obtain a significant treatment effect. However, the associated tests will lead to seemingly conflicting conclusions.
Table 5 gives the OLS regression estimate of the treatment effect. The treatment effect is highly significant, with a t-value of 4.67 (see below).
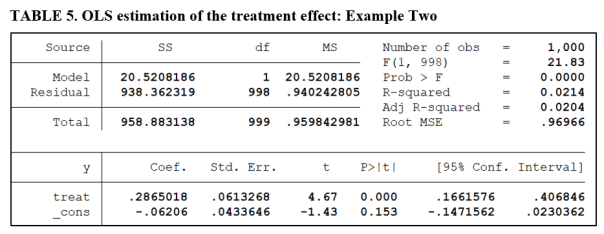
Tables 6A and 6B report the results of the Minimum Effect and Equivalence Tests.
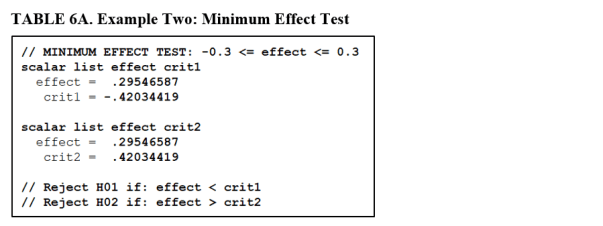
The estimated effect (Cohen’s d) is now 0.295, very close to our threshold of economic significance (0.30). The lower and upper critical values remain at their values from the first example (±0.42). A comparison of the estimated effect with the respective critical values confirms that we fail to reject both H01 and H02 for the Minimum Effect Test. This leads to the conclusion that we cannot reject the hypothesis that the treatment effect is economically unimportant.
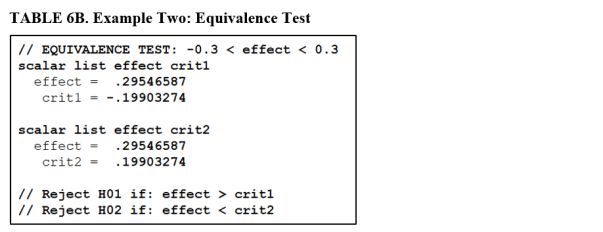
Table 6B performs an Equivalence Test on the same data. Now we compare the Cohen’s d value of 0.295 with the critical values ±0.20. We reject H01 but not H02. Accordingly, we cannot reject the hypothesis that the treatment effect is economically important.
In this example, the different tests lead to seemingly conflicting conclusions. The conflict derives from the fact that both tests produced weak conclusions. We could neither reject the hypothesis that the treatment effect was economically unimportant, nor reject the hypothesis that it was important.
In conclusion, interval testing addresses a shortcoming of NHST in that it allows us to address issues of economic importance, something that NHST is ill-equipped to do. However, it does require the researcher to declare a range of values for the effect that are deemed “economically unimportant”. Not all researchers may agree with the researcher’s choice of values.
Further, both Minimum Effect and Equivalence Tests share the weakness of all hypothesis testing in that conclusions of “Failure to reject” are weak results with respect to discriminating between null and alternative hypotheses.
*NOTE: The programming code (Stata) necessary to reproduce the results for the two examples in this blog are available at Harvard’s Dataverse: click here. Feel free to check it out and play around with the simulation parameters to produce different examples.]
Bob Reed is a professor of economics at the University of Canterbury in New Zealand. He is also co-organizer of the blogsite The Replication Network. He can be contacted at bob.reed@canterbury.ac.nz.
[From the article “We Tried to Publish a Replication of a Science Paper in Science. The Journal Refused.” by Kevin Arceneaux, Bert Bakker, Claire Gothreau, and Gijs Schumacher, published in Slate]
“Our story starts in 2008, when a group of researchers published an article (here it is without a paywall) that found political conservatives have stronger physiological reactions to threatening images than liberals do. The article was published in Science, which is one of the most prestigious general science journals around. It’s the kind of journal that can make a career in academia.”
“The researchers behind the Science article had shown a series of images to 46 participants in Nebraska and used equipment to record how much the participants’ palms sweated in response. The images included scary stuff, like a spider on a person’s face.”
“We conducted two “conceptual” replications (one in the Netherlands and one in the U.S.) that used different images to get at the same idea of a “threat”—for example, a gun pointing at the screen. … But both teams independently failed to find that people’s physiological reactions to these images correlated with their political attitudes.”
“Our first thought was that we were doing something wrong. So, we asked the original researchers for their images, which they generously provided to us, and we added a few more. We took the step of “pre-registering” a more direct replication of the Science study, meaning that we detailed exactly what we were going to do before we did it and made that public.”
“The direct replication took place in Philadelphia, where we recruited 202 participants (more than four times than the original sample size of 46 used in the Science study). Again, we found no correlation between physiological reactions to threatening images (the original ones or the ones we added) and political conservatism—no matter how we looked at the data.”
“We drafted a paper that reported the failed replication studies along with a more nuanced discussion about the ways in which physiology might matter for politics and sent it to Science. We did not expect Science to immediately publish the paper, but because our findings cast doubt on an influential study published in its pages, we thought the editorial team would at least send it out for peer review.”
“It did not. About a week later, we received a summary rejection with the explanation that the Science advisory board of academics and editorial team felt that since the publication of this article the field has moved on and that, while they concluded that we had offered a conclusive replication of the original study, it would be better suited for a less visible subfield journal.”
“We believe that it is bad policy for journals like Science to publish big, bold ideas and then leave it to subfield journals to publish replications showing that those ideas aren’t so accurate after all. Subfield journals are less visible, meaning the message often fails to reach the broader public. They are also less authoritative, meaning the failed replication will have less of an impact on the field if it is not published by Science.”
“Open and transparent science can only happen when journals are willing to publish results that contradict previous findings.”
To read more, click here.
Background: Nat Goodman is generally pessimistic about the benefits of pre-registration. Bob Reed is generally optimistic about pre-registration. What follows is a back-and-forth dialogue about what each likes and dislikes about pre-registration.
[GOODMAN, Opening Statement] We need to remember that science is a contradictory gimish of activities: creative and mundane; fuelled by curiosity and dogged by methodological minutia; fascinating and boring; rigorous and intuitive; exploratory, iterative, incremental, and definitive.
Instead of trying to rein in the galloping horse we call science, we should be trying to spur it on. We should be looking for new methods that will make scientists more productive, able to produce results more quickly — and yes, this means producing more bad results as well as more good.
[REED, Opening Statement] In a recent interview, Nicole Lazak, co-author of the editorial accompanying The American Statistician’s special issue on statistical significance, identified pre-registration as one of the “best ways” forward for science (see here).
The hope is that pre-registration will provide some discipline on researchers’ tendencies to “graze” through various research outputs in search of something interesting. It is precisely that kind of “grazing” that encourages the discovery of spurious relationships. As spurious relationships are the root cause of the “replication crisis”, pre-registration provides direct medicine for the sickness.
[GOODMAN] Pre-registration is important for confirmatory research but irrelevant for exploratory work. The purpose of pre-registration is to eliminate post hoc investigator bias. To accomplish this, preregistered protocols must fully specify the study (including data analysis) with sufficient detail that a completely different team could carry out the work. This may sound over-the-top but is the norm in clinical trials of new drugs and focused social science replication projects.
Many people support a soft form of pre-registration in which the preregistered protocol is simply a statement of intent and suggest that this form of pre-registration can be used for exploratory research. I don’t see the point. In my experience, exploratory research never goes as expected; we learn how to do the study by doing the study. Comparing the final method with the original plan is humbling to say the least.
[REED] Effective pre-registration should be more than a statement of intent. It should clearly identify the goals of the research, the set of observations to be used, variables to be included in the analysis, and principles for modifying the analysis (e.g., criteria for eliminating outliers). The goal is to prevent HARKing and (possibly unconscious) p-hacking.
Let me explain why I believe pre-registration can be effective in preventing HARKing and reducing p-hacking.
A lot of research consists of looking for patterns in data. In other words, exploratory research. However, too often the patterns one observes are the results of random chance. This itself wouldn’t be so bad if there was a feasible way to adjust the statistical analysis to account for all the paths one had taken through the garden. Instead, researchers report the results of their exploratory analysis as if it were the one-shot, statistical experiment that significance testing presumes.
Pre-registration limits the number of paths one explores, making it less likely that one stumbles upon a random-induced pattern. Where one discovers something after departing from the pre-registration plan, it helps readers to properly categorize the finding as exploratory, rather than confirmatory.
It is important to note that pre-registration does not preclude researchers from exploring data to look for interesting relationships. Rather, the goal of pre-registration is to get researchers to distinguish between confirmatory and exploratory findings when reporting their empirical results. In the former case, statistical inference is valid, assuming the researcher makes Bonferroni-type adjustments when conducting multiple tests. In the latter case, statistical inference is meaningless.
There is some evidence that it works! Recent studies report that effect sizes are smaller when studies have been pre-registered, and that there are fewer significant findings (see here and here).
[GOODMAN] There is also evidence that pre-registration has not worked. Early results from studies that have been pre-registered indicate that researchers have not been careful to distinguish exploratory from confirmatory results (see here). There is good reason to believe that these early returns are not aberrations.
According to your model, exploratory results should be viewed with greater scepticism than results from confirmatory analysis. But researchers who want to see their work published and have impact will always have an incentive to blur that distinction.
I am not alone in my pessimism about pre-registration. Others have also expressed concern that pre-registration does not address the problem of publication bias (see here).
Pre-registration is a non-cure for a misdiagnosed disease. Current scientific culture prizes hypothesis-driven research over exploratory work. But good hypotheses don’t emerge full-blown from the imagination but rather derive from results of previous work, hopefully extended through imaginative speculation.
The reality is that the literature is filled with papers claiming to be “hypothesis-driven” but which are actually a composite of exploration, post hoc hypothesis generation, and weak confirmation. This is how science works. We should stop pretending otherwise.
Let me get back to what I think is a fundamental contradiction in pre-registration. As I understand it, economics research often involves analysis of pre-existing data. Since the data exists before the study begins, the only way to avoid post-hoc pattern discovery is to prevent the investigator from peeking at the data before pre-registering his research plan. This seems infeasible: how can someone design a study using a dataset without pretty deep knowledge of what’s there?
[REED] It’s not the peeking at the data which is the problem, it is estimating relationships. Suppose my data has one dependent variable, Y, and 10 possible explanatory variables, X1 to X10. Pre-registration is designed to reduce unrestricted foraging across all data combinations of X variables to find significant relationships with Y. It does this by requiring me to say in advance which relationships I will estimate. Yes, I must look at the data to see which variables are available and how many usable observations I have. No, this does not eliminate the value of a pre-registration plan.
[GOODMAN] Pre-registration puts the emphasis on the wrong thing. Instead, greater emphasis should be placed on developing confirmation procedures. Devising good confirmation procedures is an important area of methodological research. For example, in machine learning the standard practice is to construct a model using one dataset and test the model on another dataset (if you have enough data) or through bootstrapping. This might just do the trick in fields like economics that depend on analysis of large preexisting databases.
Further, as others have noted, the “fast spread of pre-registration might in the end block” other approaches to solving problems of scientific reliability because “it might make people believe we have done enough” (see here).
[REED] I’m only somewhat familiar with the uses of bootstrapping, but I don’t think this can solve all problems related to p-hacking and HARKing. For example, if there is an omitted variable that is highly correlated with both an included variable and the dependent variable, the included variable will remain significant even if one bootstraps the sample. Thus, while these can be useful tools in the researcher’s toolbox, I don’t believe they are sufficiently powerful to preclude the use of other tools, like pre-registration.
With regard to pre-registration potentially crowding out more effective solutions, I agree this is a possibility, but I’d like to think that researchers could do the scientific equivalent of chewing gum and walking at the same time by adopting pre-registration + other things.
[REED, Conclusion] I think our “debate” has played out to the point of diminishing returns, so let me give my final spin on things. I think we both agree that pre-registration is not a silver bullet. First, we don’t want to tie researchers’ hands so they are prevented from exploring data. Second, pre-registration can be ignored and, worse, manipulated. These weaken its ameliorative potential. On these two points we both agree.
Where we disagree is that Nat thinks there is only a negligible benefit to pre-registration for exploratory research, while I think the benefit can be substantial. In my opinion, the benefit accrues mostly to well-intentioned researchers who might accidentally wander around the garden of forking paths without appreciating how it diminishes the significance of their findings (both statistical and practical). While this won’t eliminate the problem of p-hacking and HARKing, I think requiring researchers to complete a pre-analysis plan will make well-intentioned researchers less likely to fall into this trap. And if you believe that most researchers are well-intentioned, as I do, that can lead to a significant improvement in scientific practice, and reliability.
Nat Goodman is a retired computer scientist living in Seattle Washington. His working years were split between mainstream CS and bioinformatics and orthogonally between academia and industry. He can be contacted at natg@shore.net.
Bob Reed is a professor of economics at the University of Canterbury in New Zealand. He is also co-organizer of the blogsite The Replication Network. He can be contacted at bob.reed@canterbury.ac.nz.
[From the paper, “Analysis of Open Data and Computational Reproducibility in Registered Reports in Psychology” by Pepijn Obels, Daniel Lakens, Nicholas Coles, & Jaroslav Gottfried, posted at PsyArXiv Preprints]
“Recently, scholars have started to empirically examine the extent to which data is shared with published articles, and, if so, whether it was possible to reproduce the data analysis reported in the published article.”
“Hardwicke et al. (2018) examined the reproducibility of 35 articles published in the journal Cognition. Eleven articles could be reproduced without assistance from the original authors, and 13 articles contained at least one outcome that could not be reproduced even with author assistance.”
“Stockemer, Koehler, and Lentz (2018) analyzed reproducibility in all articles published in 2015 in three political science journals. They … found that for 71 articles for which they received code and data, one could not be reproduced due to a lack of a software license, and 16 articles could not be reproduced with access to the required software. For the remaining articles, 32 could be exactly reproduced, 19 could be reproduced with slight differences, and 3 articles yielded significantly different results.”
“Stodden, Seiler, and Ma (2018) analyzed data availability in the journal Science in 2011-2012 and found that 26 of 204 (or 13%) of articles provided information to retrieve data and/or code without contacting the authors. For all datasets they acquired after e-mailing authors for data and code, 26% was estimated to be computationally reproducible.”
“We set out to examine the data availability and reproducibility in Registered Reports published in psychological science.”
“To find Registered Reports published in psychology we drew from a database of registered reports maintained by the Center for Open Science.”
“…we limited ourselves to statistical software packages that we had experience with (R, SPSS, and JASP) and excluded studies that required expertise in software packages we are not trained in (e.g., dedicated EEG software, Python, Matlab)…”
“We set out to reproduce the 62 papers that met our inclusion criteria.”
“Of these 62 papers … 40 shared the analysis script and data, for which 35 were in SPSS, R or JASP. Of these, the analysis script could be run for 30, of which 19 reproduced all main results.”
“One of the main goals of our project was to identify ways to improve the reproducibility of published articles. … This leads to 4 points researchers in psychology should focus on to improve reproducibility, namely (a) add a codebook to data files, (b) annotate code so it is clear what the code does, and clearly structure code (e.g., using a README) so others know which output analysis code creates, (c) list packages that are required in R and the versions used at the top of your R file, (d) check whether the code you shared still reproduces all analyses after revisions during the peer review process.”
“The main aim of this article was not to accurately estimate mean reproducibility rates, but to see what current standards are, and how the reproducibility of research articles using the Registered Report format could be improved. … the main contribution of this article is the identification of common issues that can be improved.”
To read the paper, click here.
[In a recent post at TRN, we highlighted that positive results were drastically lower in registered reports. In this post, we report findings about effect sizes. Excerpts are taken from “The Meaningfulness of Effect Sizes in Psychological Research: Differences Between Sub-Disciplines and the Impact of Potential Biases” by Thomas Schäfer and Marcus Schwarz, recently published in Frontiers in Psychology]
“…how large is the problem of inflated effects? … the Open Science Collaboration (2015) found that replication effects were half the magnitude of original effects. … But the Open Science Collaboration’s focus on replication studies and use of … studies from high-ranked journals means there might not be sufficient information to reliably estimate the difference between published (i.e., potentially biased) effects and “true” … effects representative of the population…”
“In the present study, we employed a broader basis of empirical studies and compared the results of original research that has either been published traditionally (and might therefore be affected by the causes of bias just mentioned) or been made available in the course of a pre-registration procedure (therefore probably not affected by these biases).”
“…to get a representative overview of published effects in psychology, we analyzed a random selection of published empirical studies. … to estimate how strongly published effects might be biased, we distinguished between studies with and without pre-registration.”
“Since pre-registered studies have gained in popularity only in recent years, we did not expect there to be that many published articles adhering to a pre-registration protocol. We therefore set out to collect all of them instead of only drawing a sample.”
“Because our aim was to get an impression of the distribution of effects from psychological science in general, we transformed all effect sizes to a common metric if possible. As the correlation coefficient r was the most frequently reported effect size … we transformed effects to r whenever possible.”
“…resulting in 684 values for r in total for studies without pre-registration and 89 values for r in total for studies with pre-registration.”
“Figure 1 (upper part) shows the empirical distribution of effects from psychological publications without pre-registration … The distribution is fairly symmetrical and only slightly right-skewed, having its mean at 0.40 and its grand median at 0.36.”
“Figure 1 (lower part) shows the empirical distribution of effects from psychological publications with pre-registration … It has its mean at 0.21 and its grand median at 0.16.”

“Our finding that effects in psychological research are probably much smaller than it appears from past publications has … a disadvantageous implication. … smaller effect sizes mean that the under-powering of studies in psychology is even more dramatic than recently discussed … because smaller population effects would require even larger samples to produce statistical significance.”
To read the article, click here.


You must be logged in to post a comment.